USA Real Estate - Predicting Sales Price
Predicting Price in USA Real Estate Market
In this exercise, we will use regression techniques on housing market in the US. The dataset used is a Kaggle dataset which can be found here.
We will go through data cleaning, investigate distributions, exploratory data analysis, and then finally modeling using several regression models.
The dataset consists of these fields:
- Price
- Bed
- Bath
- Acre Lot
- House Size
- Address
- Zipcode
- City
- State
Exploratory Data Analysis
The dataset consists of 100,000 rows and 11 columns. After analyzing the dataset, it seems like there are buildings included in the sale. For example, the max beds in the dataset is 86 and max baths is 56. For this exercise the data was cut off at 6 bedrooms and 5 bathrooms.
After removing other outliers using IQR, the resulting dataframe was a little over 44,000.
The top 5 zipcodes in terms of average price were primarily located in MA(2),CT(1),NY(1), and VI(1). For top 5 zipcodes in terms of average $/sqft were in MA(4) and CT(1). I would have figured that New York City area would have at made it to the top 5, but according to the data, it did not.
Zipcode and City were transformed using Category Codes, which labeled them as numbers. I am not sure if this was the right approach, but when I used one hot encoder, the processing time increased dramatically. This is due to the encoder increasing the number of features to 4000+.
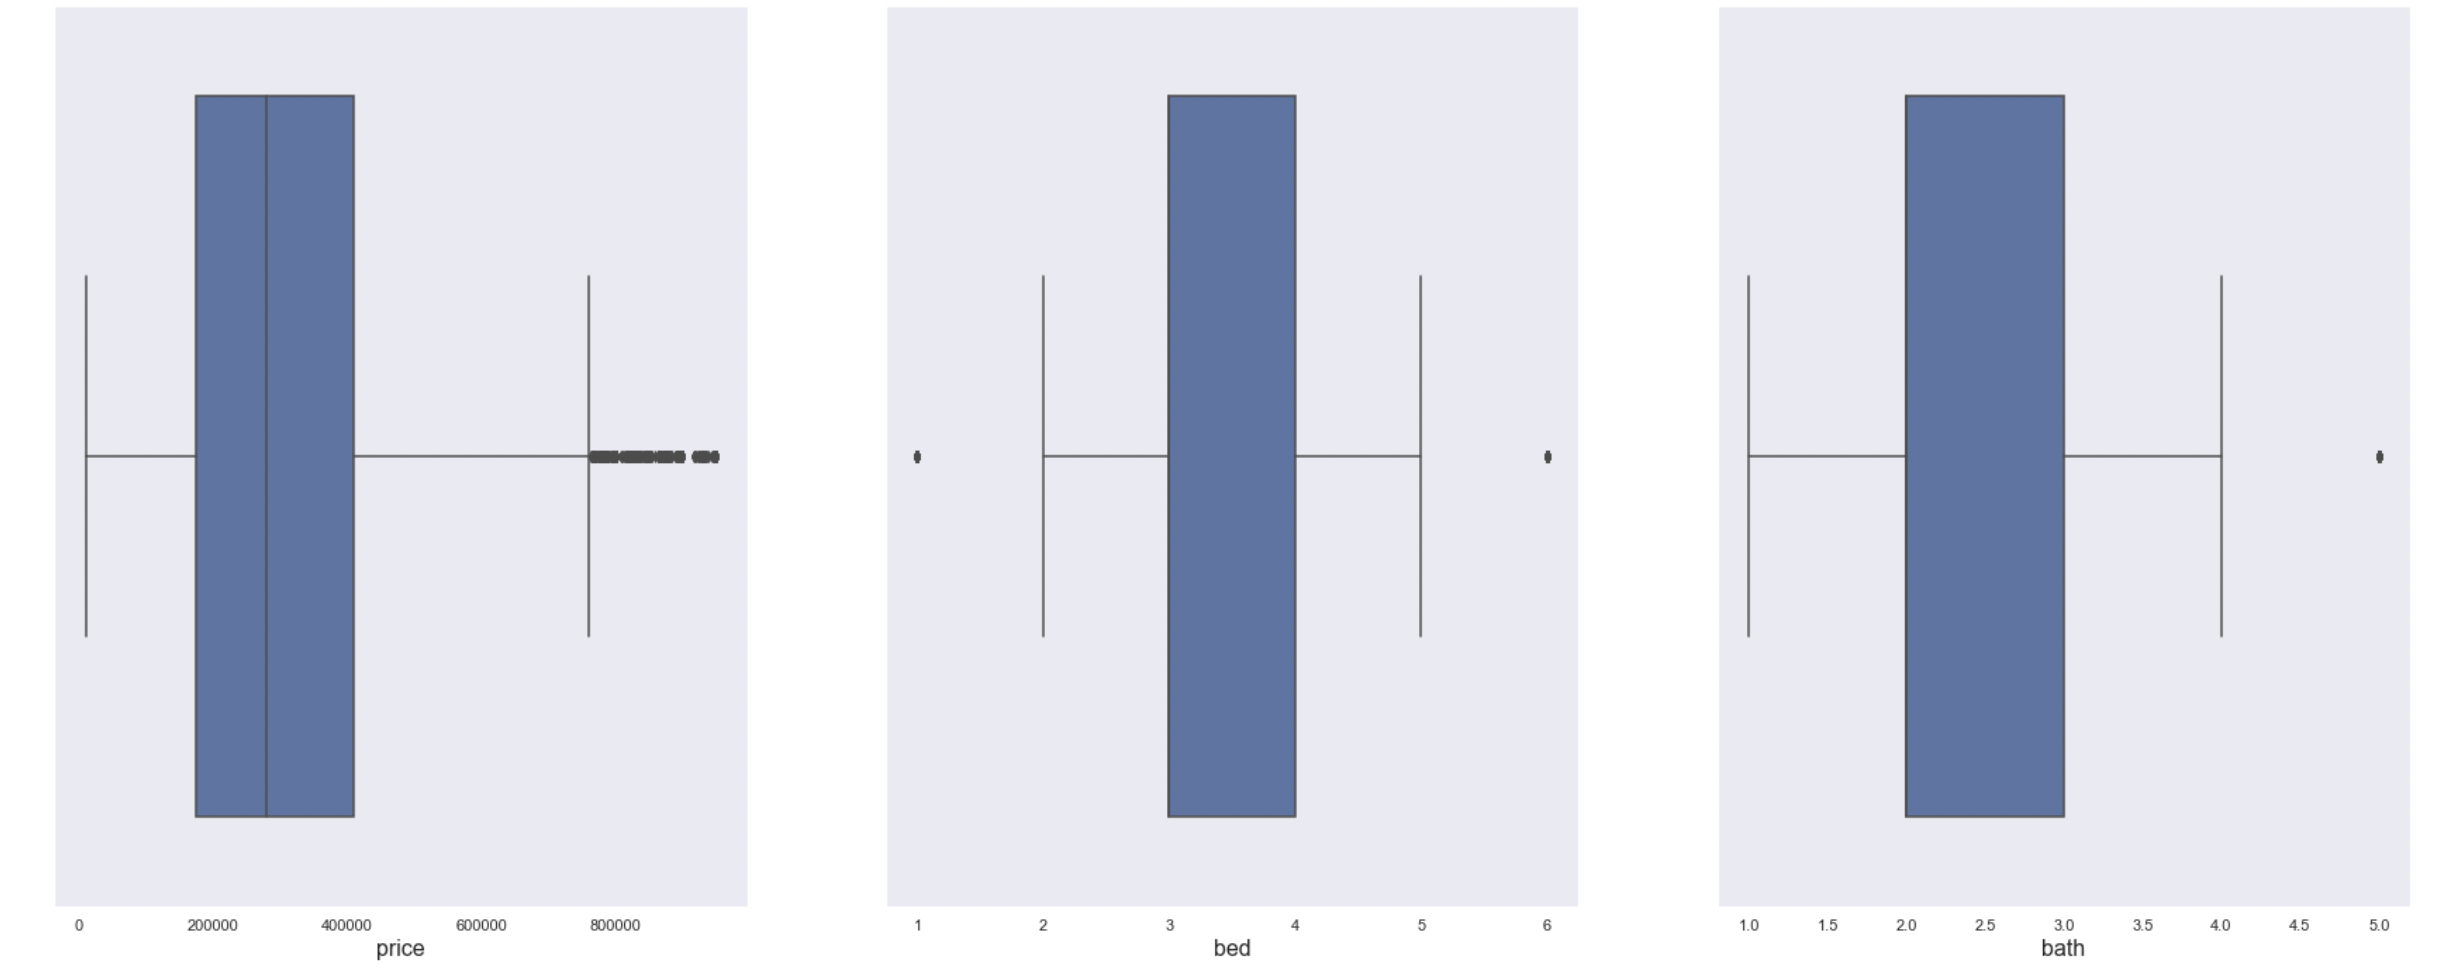
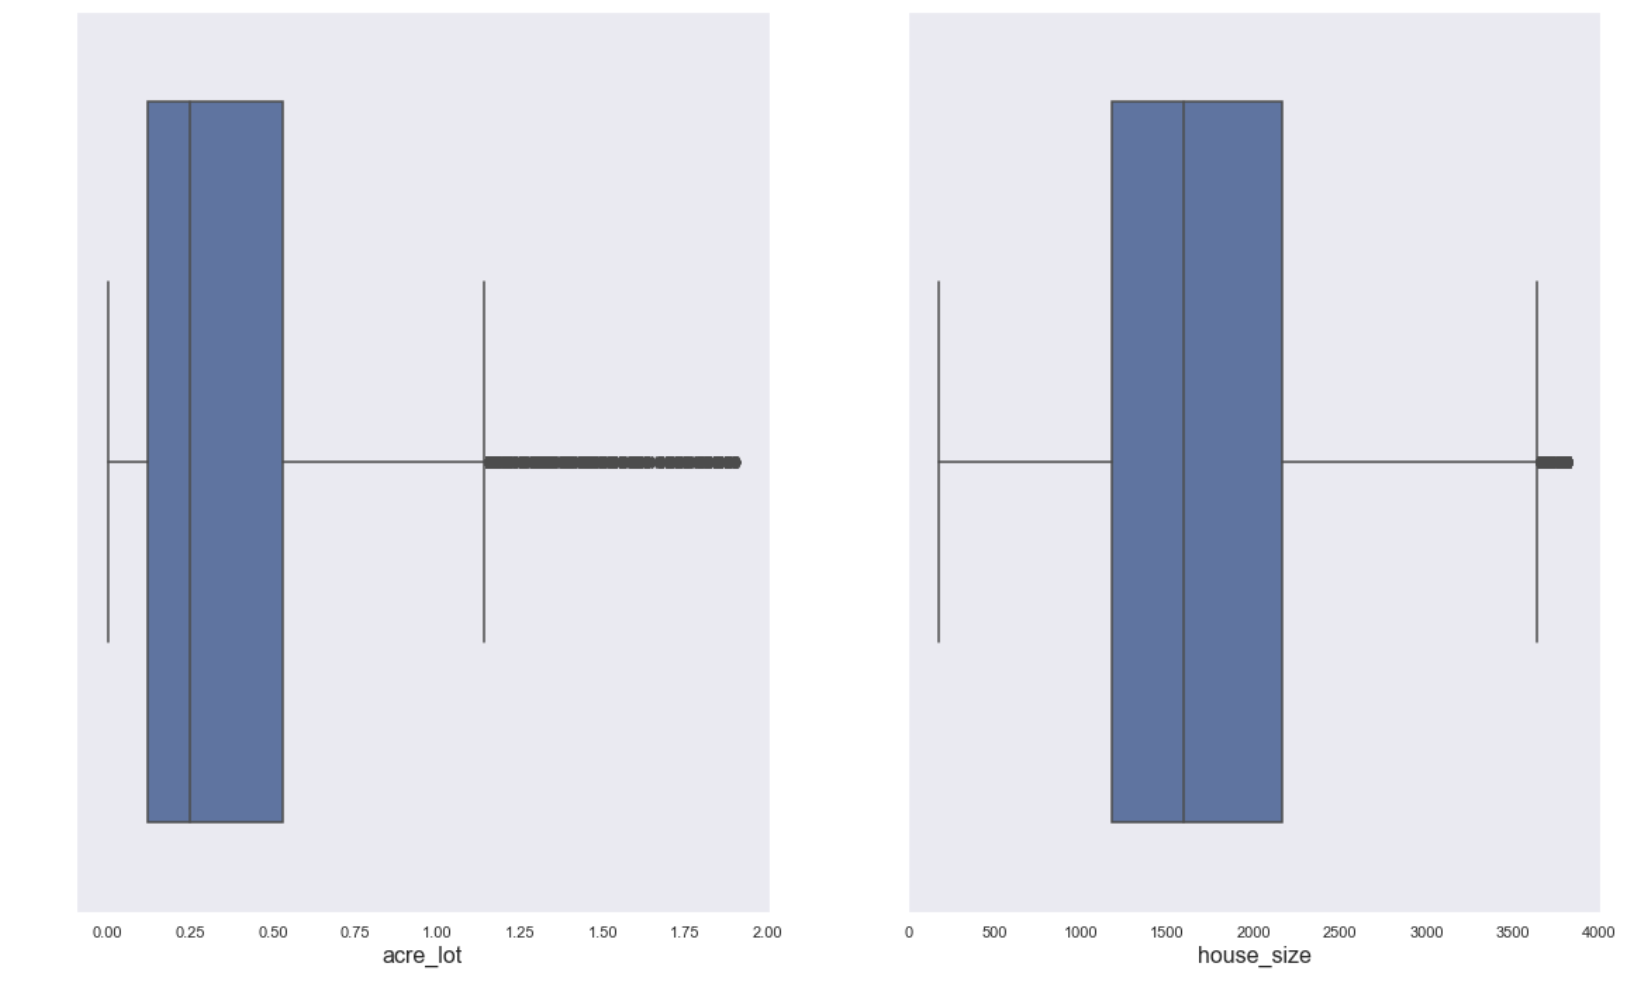
Box Plots
The box plots (below) show that the features with the most outliers are: price, acre lot, and house size.
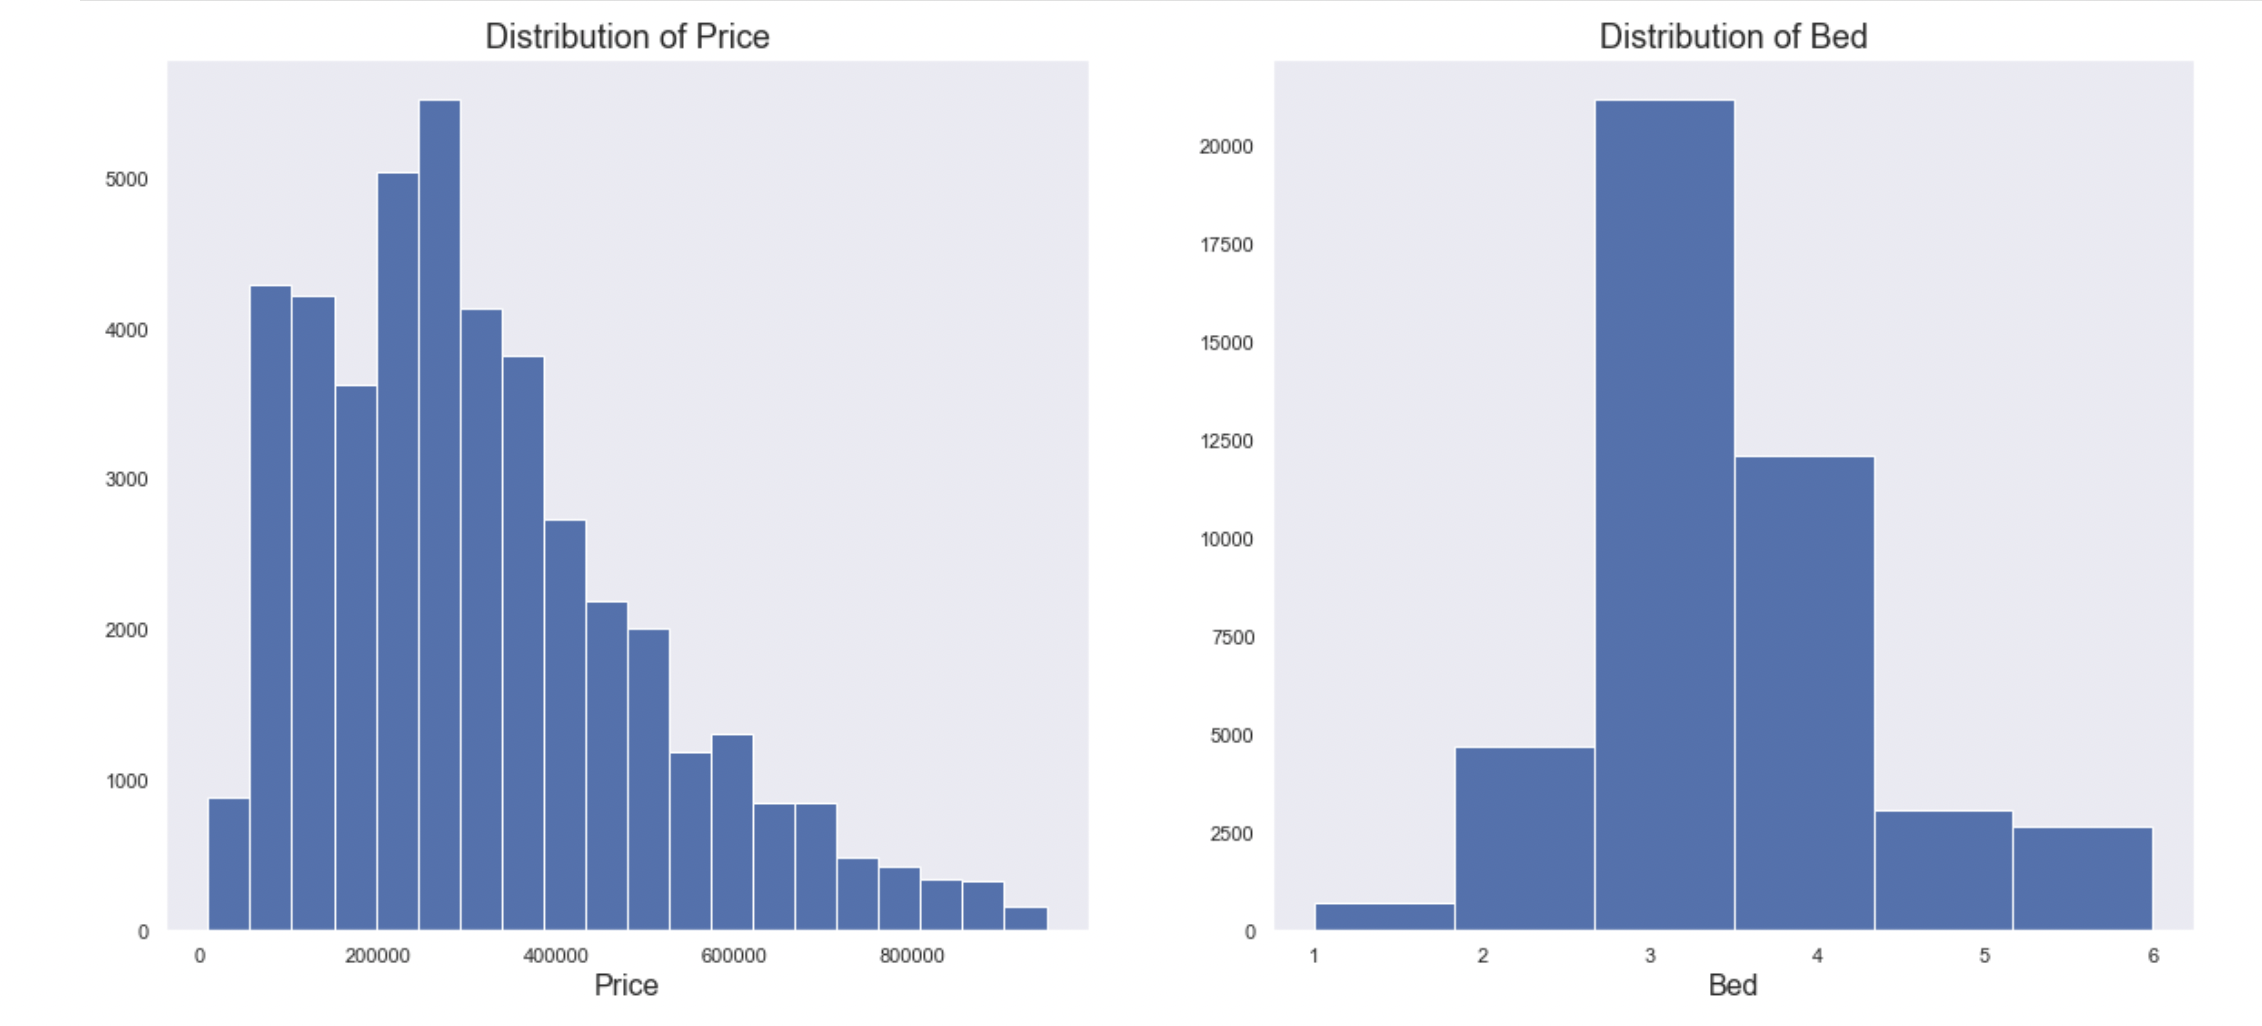
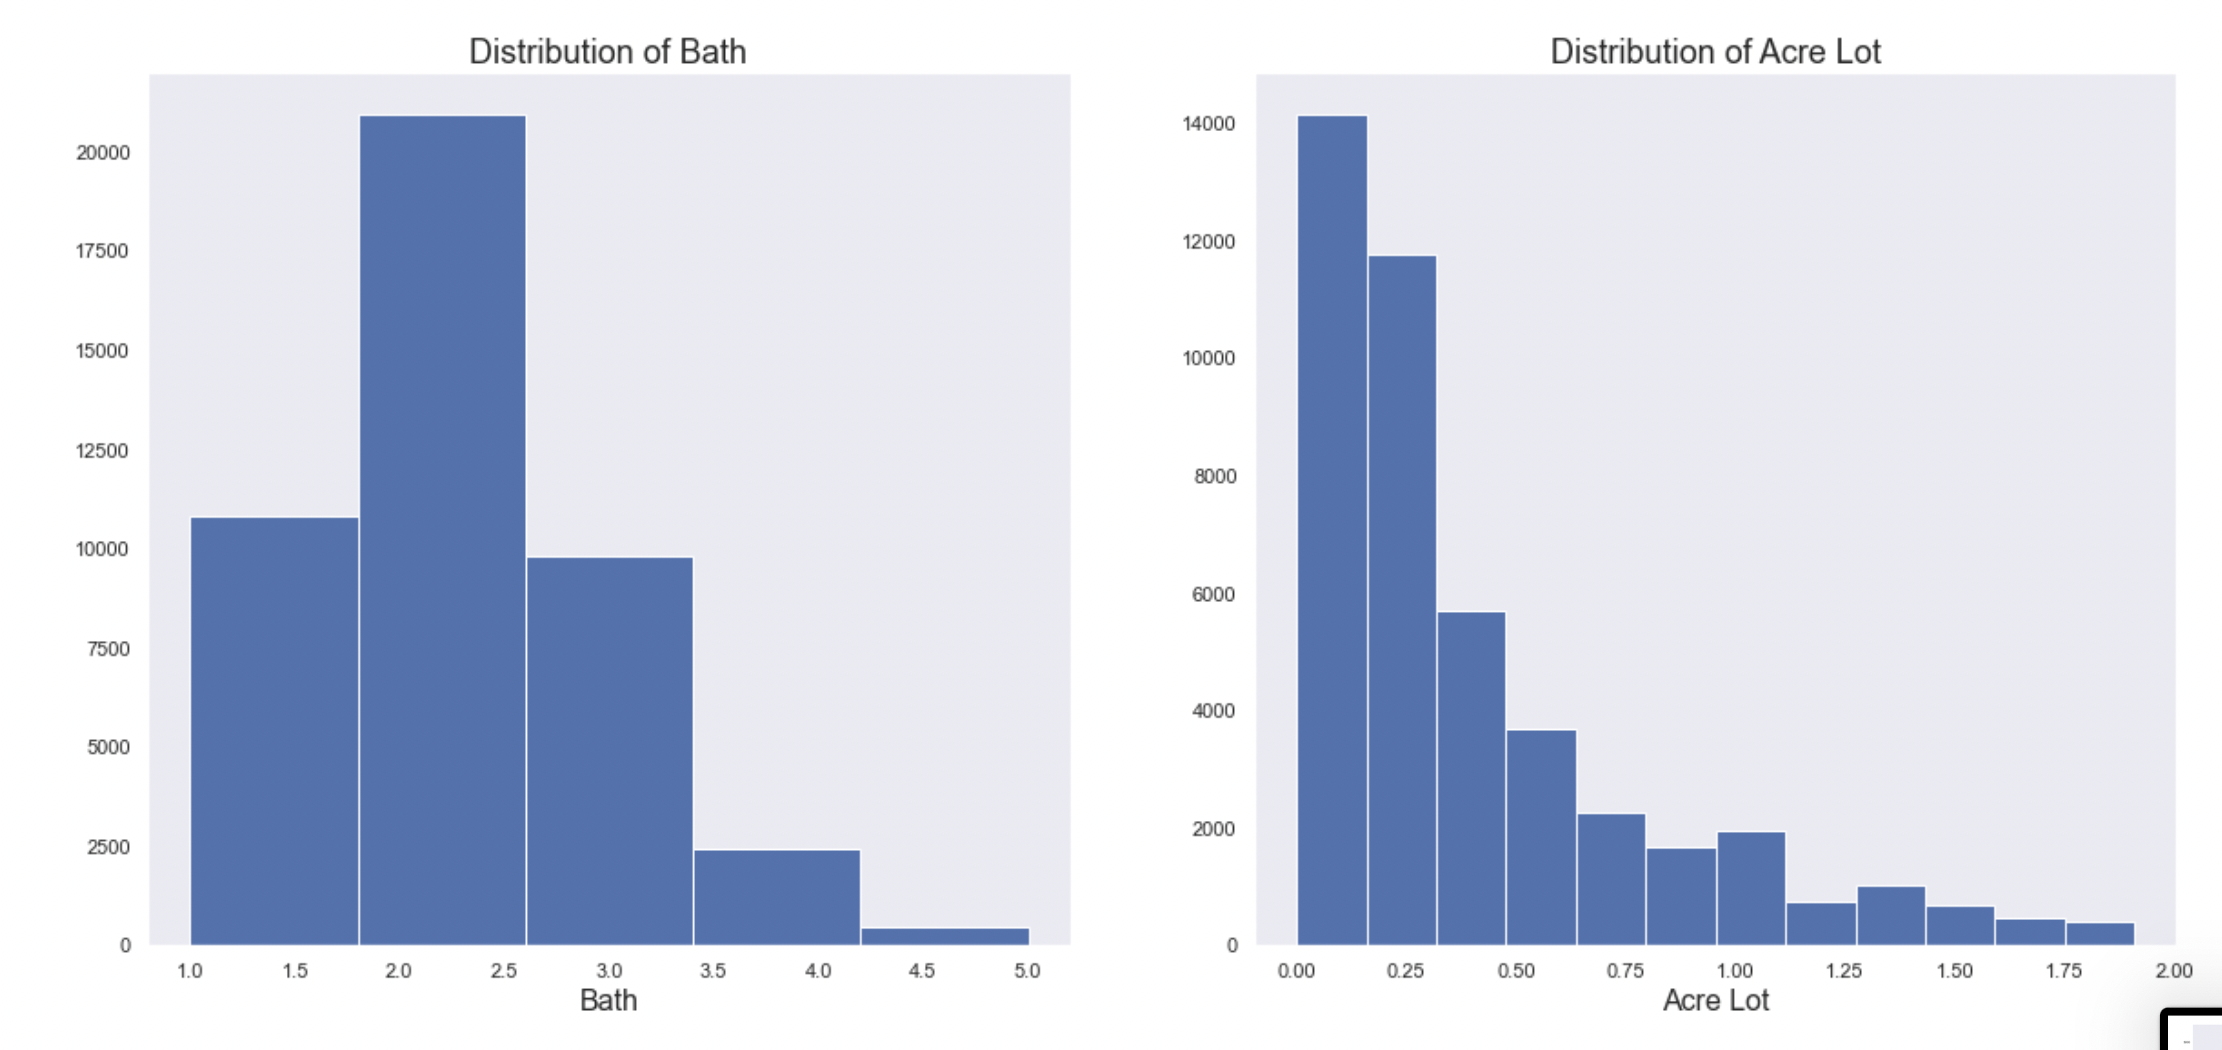
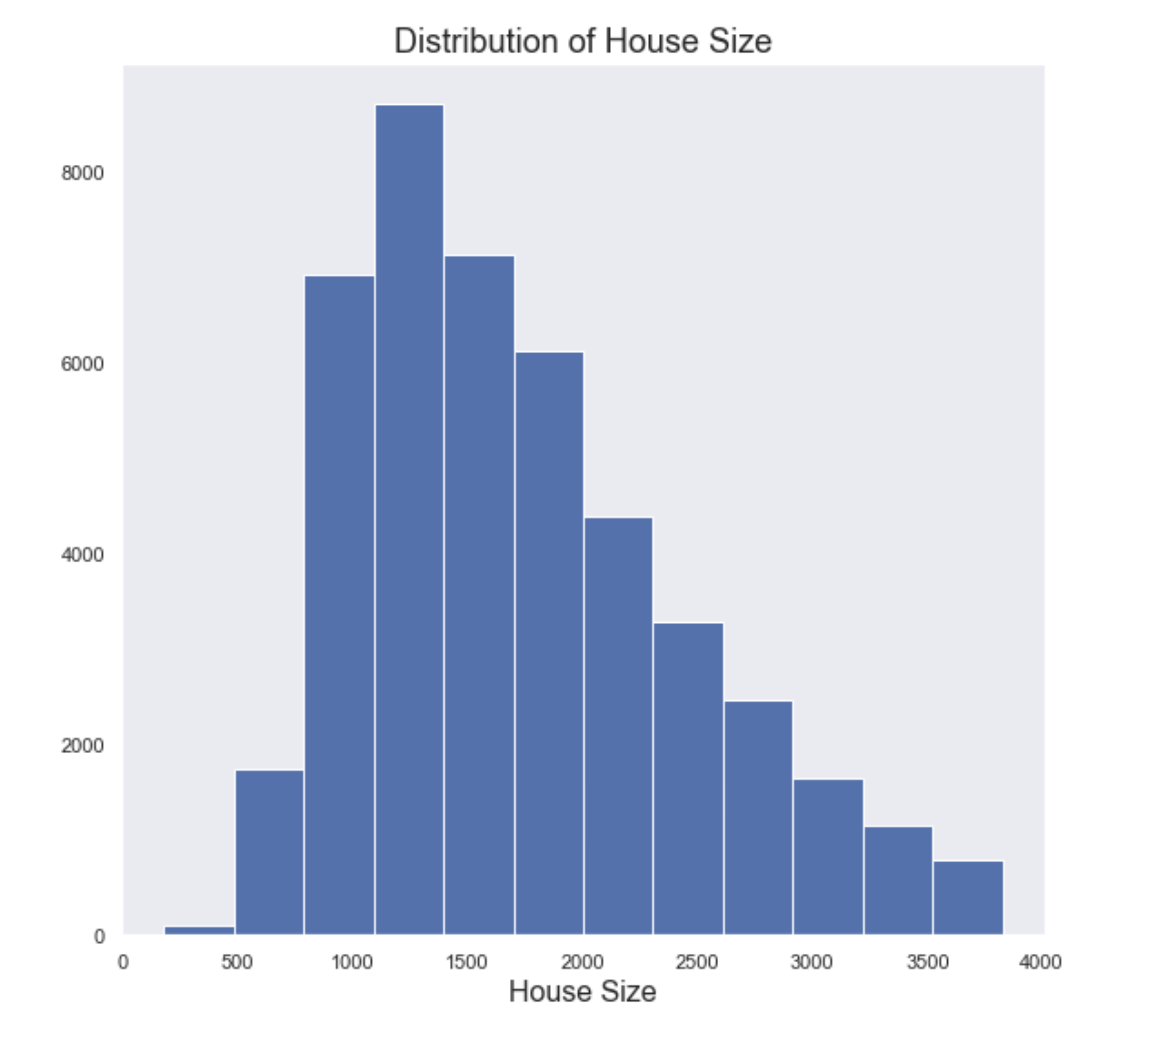
Histograms
The histograms (below) show that the features that are left skewed are: price, acre lot, and house size.
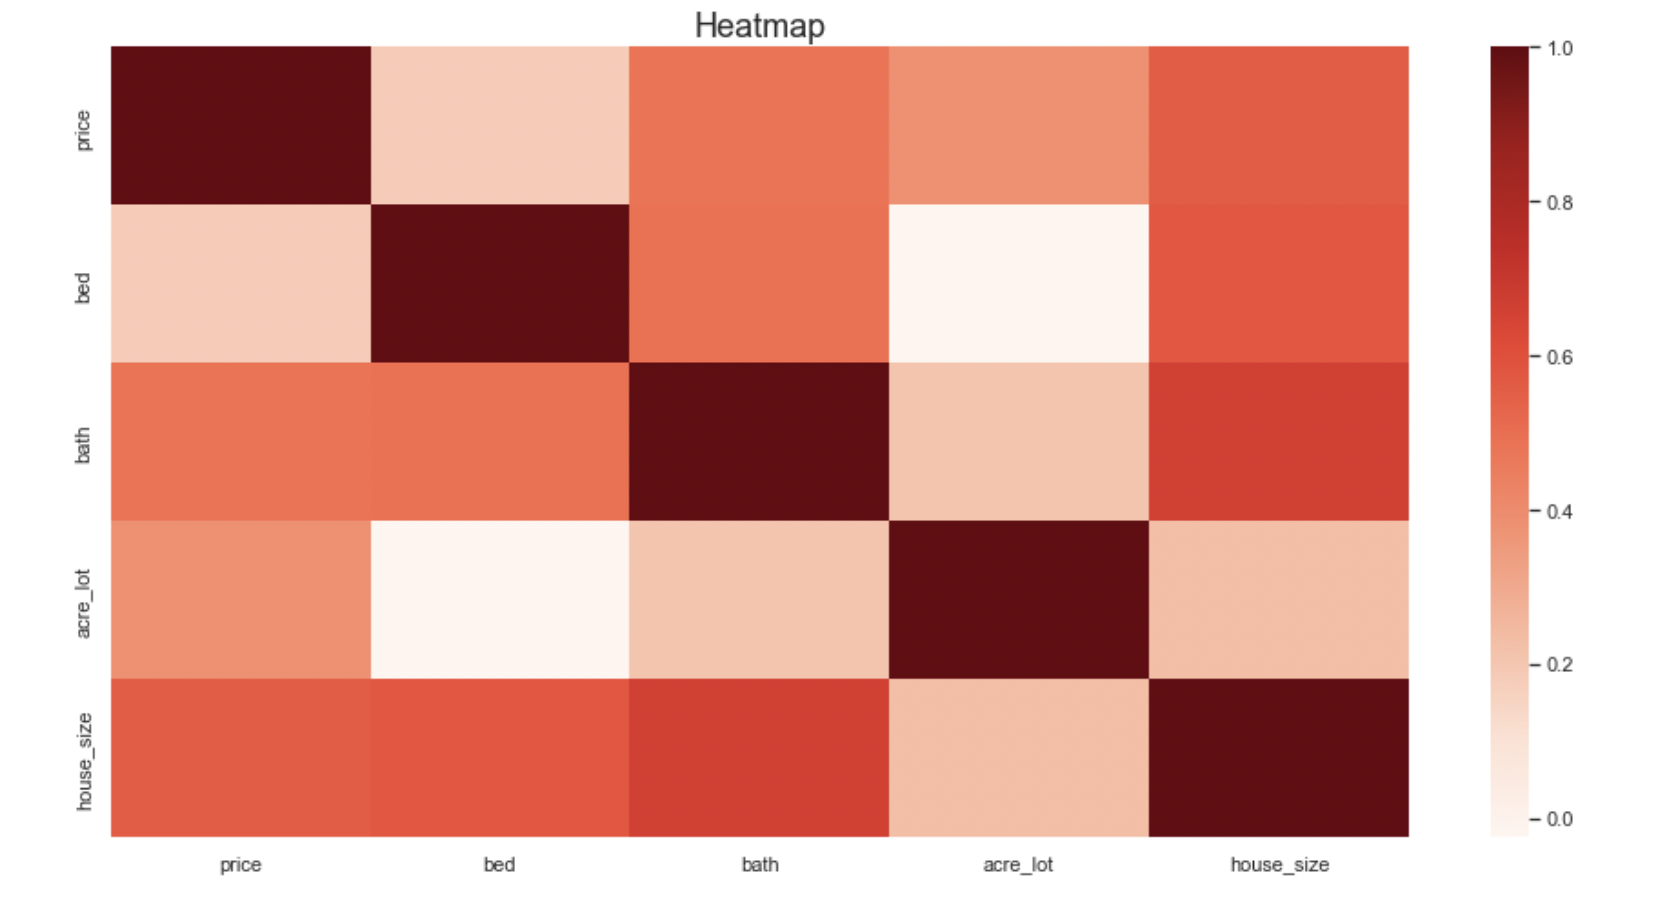
Heatmap
Modeling
The three models used were:
- Decision Tee
- Random Forest
- Extra Trees
Extra Trees performed the best, but overall there might be overfitting due to the score for all 3.
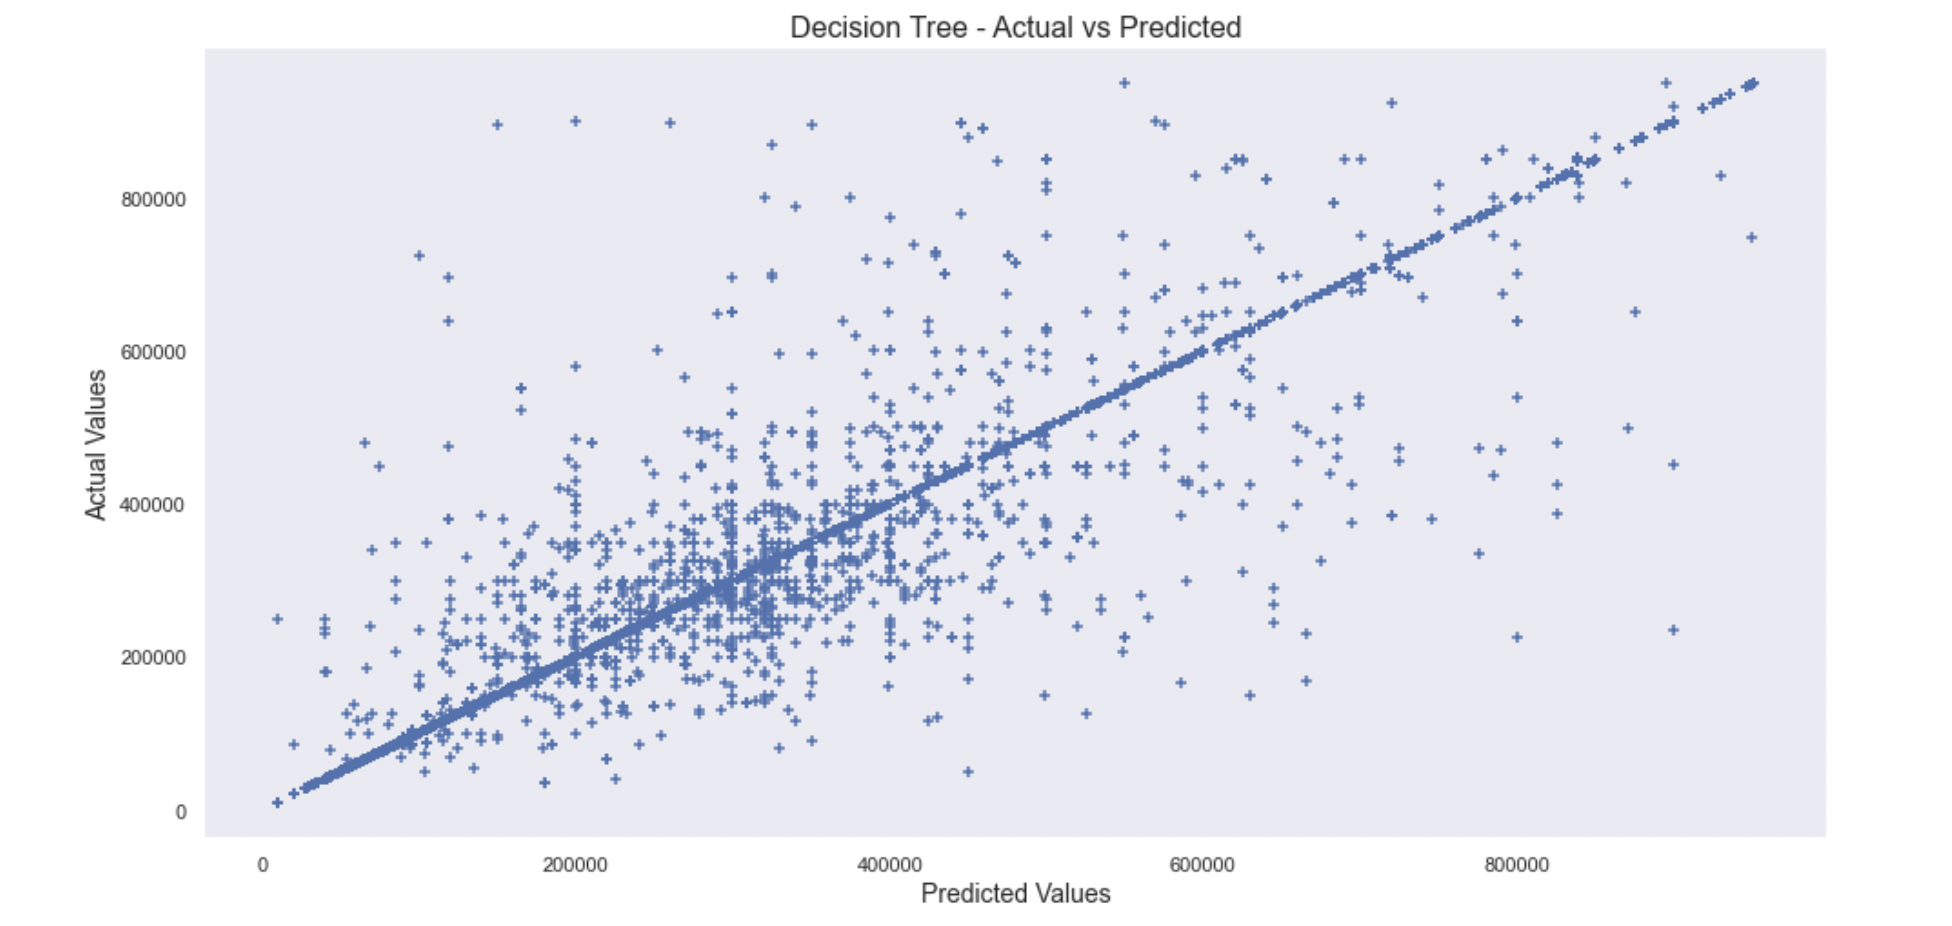
Decision Tree
- The mean absolute error: 7602
- Score: 0.956
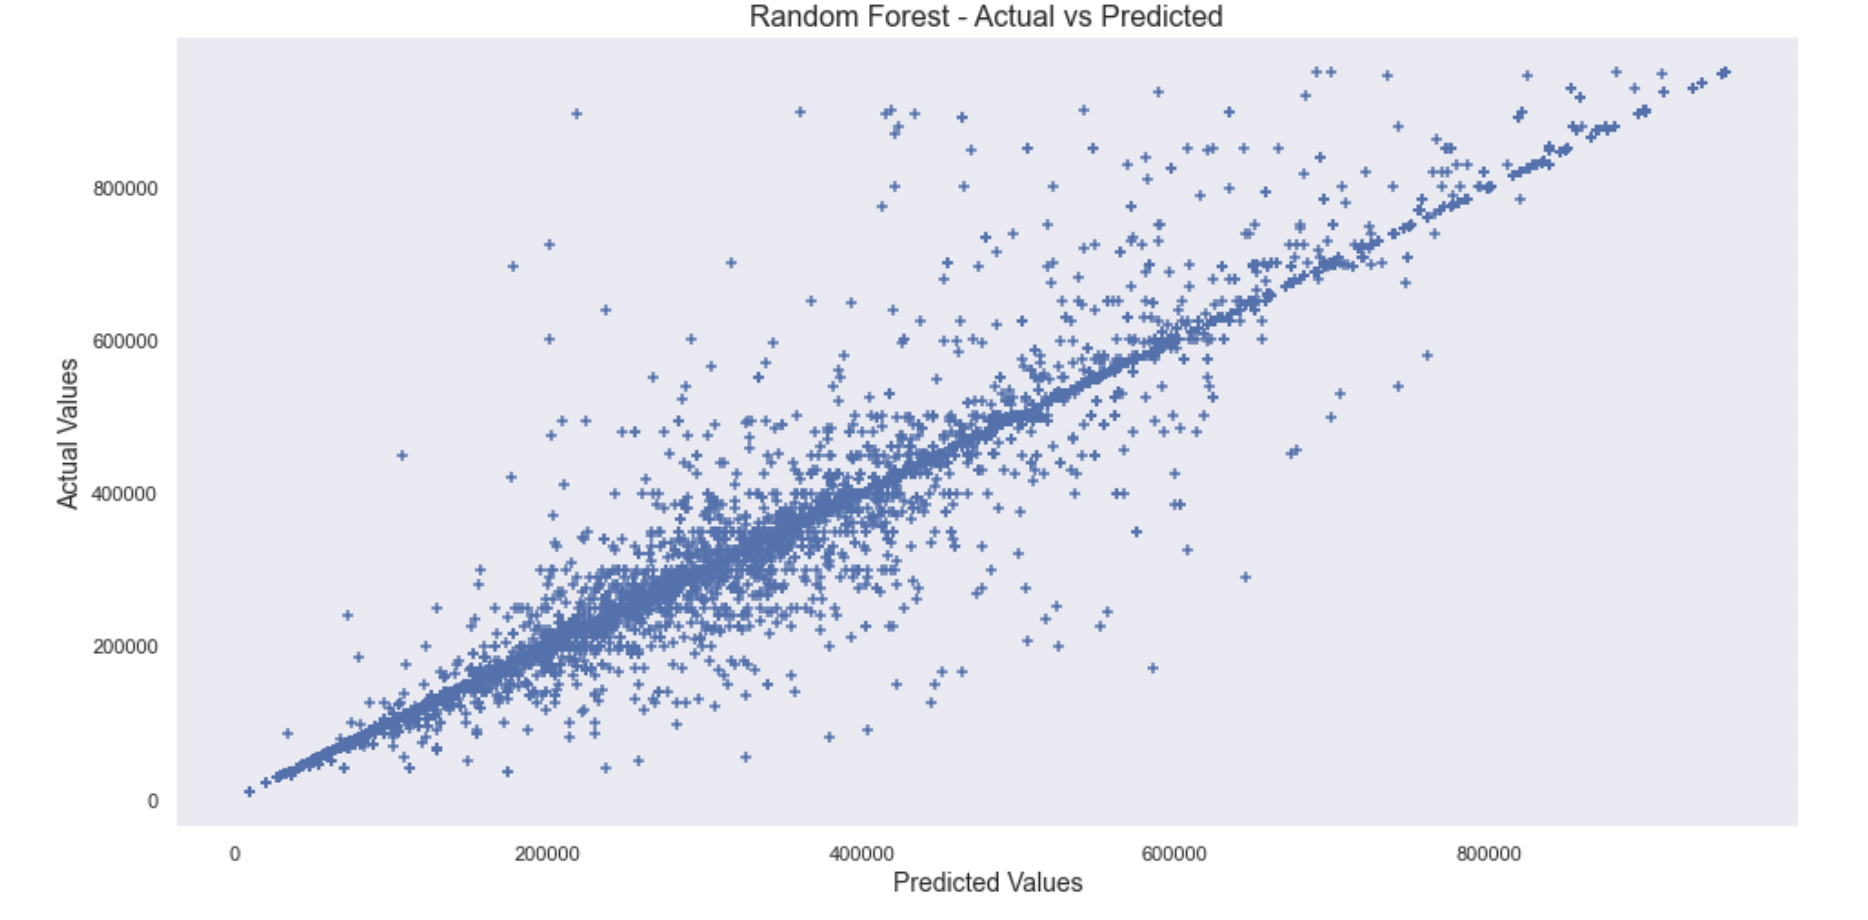
Random Forest
- The mean absolute error: 7778
- Score: 0.956
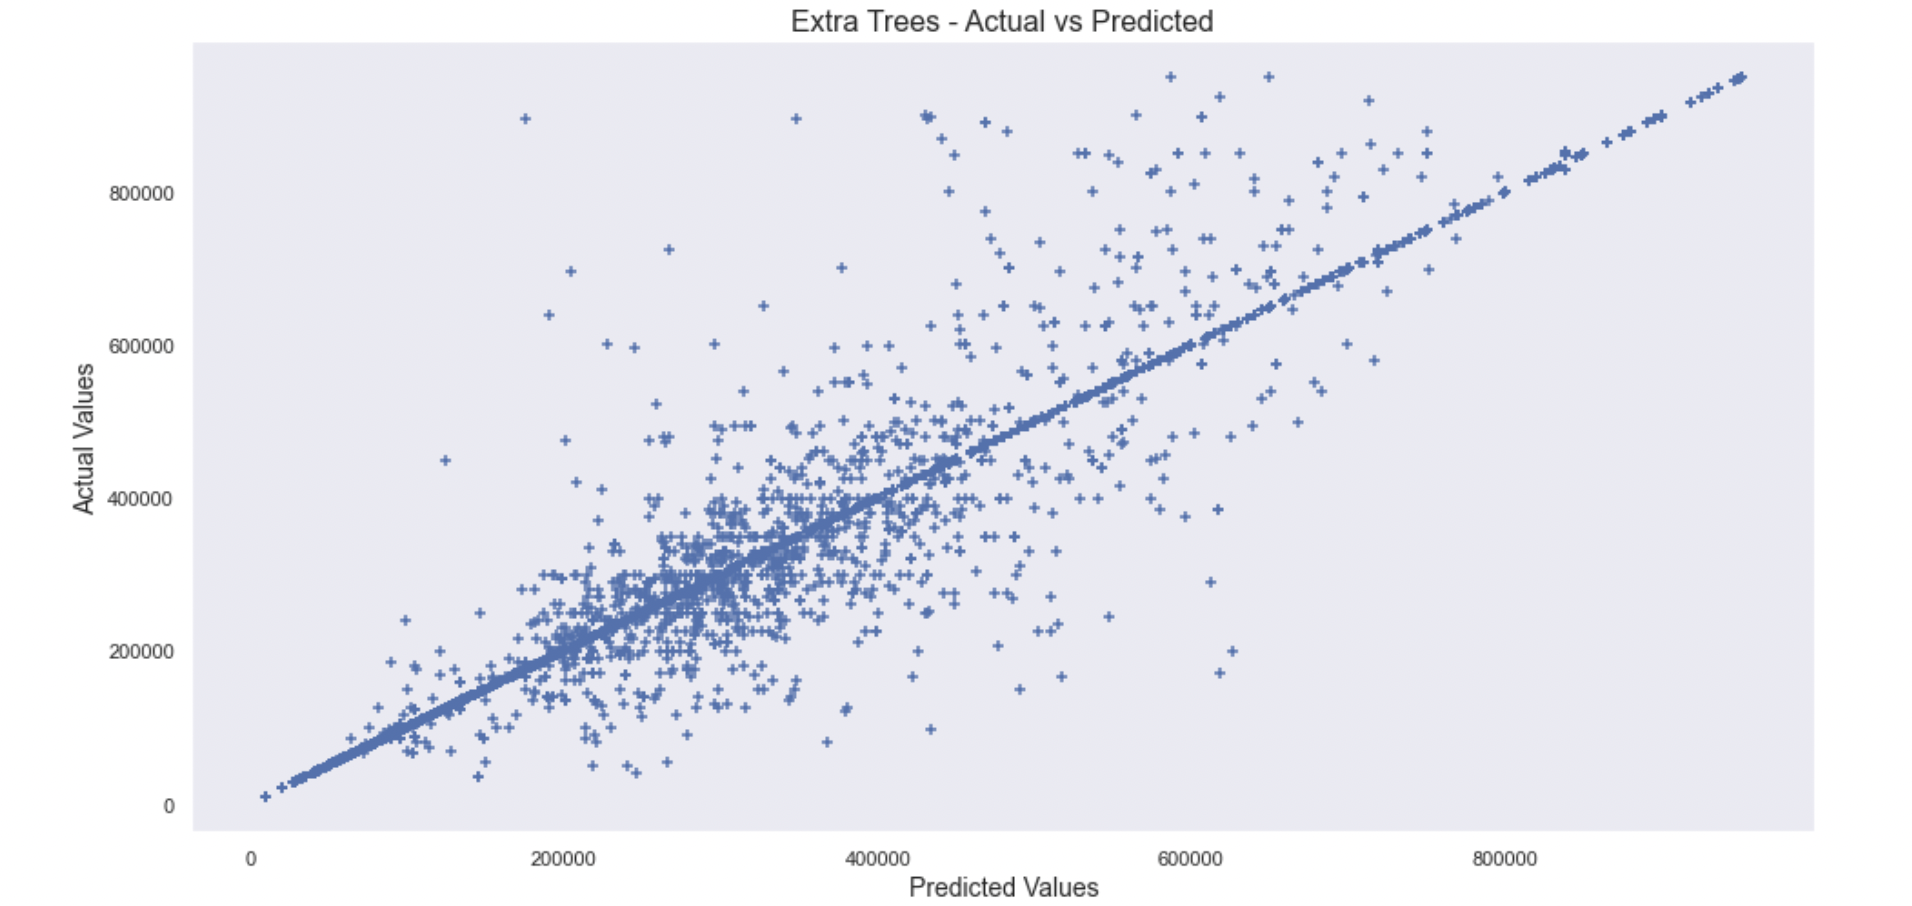
Extra Trees
- The mean absolute error: 5590
- Score: 0.975
Conclusion
The score for Decision Trees, Random Forest, Extra Trees suggests that it could be overfitting. I am not sure if using the category codes was the best move, but when I tried doing the one hot encoder, using regression models took a lot of computational time due to the 4000+ features it had to go through.
In terms of scores, the Extra Trees regressor was the best, then Random Forest, then Decision Trees.
In later iterations, I will have to see if there are ways to address this and also overfitting.