Why Do Good Employees Leave?
Why Do Good Employees Leave?
This analysis looks what which employees with a high evaluation score will leave the company. The dataset was taken from Kaggle, which is located here. The dataset does not need any Data Munging, so this analysis will cover Data Analysis on what features contribute to good employees leaving.
Overall analysis of employees that Leave
It is found that most employees tend to leave around year 3 and decrease with each year, with bulk of employees leaving around years 3 to 5. Evaluating the distribution of average monthly hours worked by employees that worked there between 3 and 5 years, we see two clusters. One that worked less than 160 hours and one that worked over 225 hours. Thus, either the employee was underworked or overworked. The median satisfaction level for this group was 0.4, and the last evalation score was 0.52 (median). If this group was purely working less than 160 hours a month, one could surmise that they did not work as much and thus got a low evaluation score, but there is a group that worked more than 225 hours a month (45 hours a week or more) and got a low evaluation score. One would need to understand the metrics behind evaluations to understand what is driving the data. Surely, these group of people are not satisfied with their jobs and decided to leave or were forced out.
Evaluating why good employees leave
Among those employees that left, 25% of the population got 0.52 on their evaluation. Half the population got 0.79 on their evaluation. The mean evaluation is 0.71. Employees with evaluation scores above 0.71 resulted in a count of 7606. Among those, the employees that left were 1893. This is about 25% of the employees.
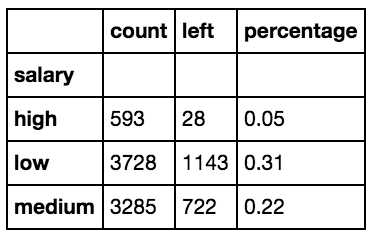
Analyzing the relationship between salary and employees leaving, majority were low/medium salary. About 98% of the employees that left were low/medium salary while 92% of all employees were in this category.
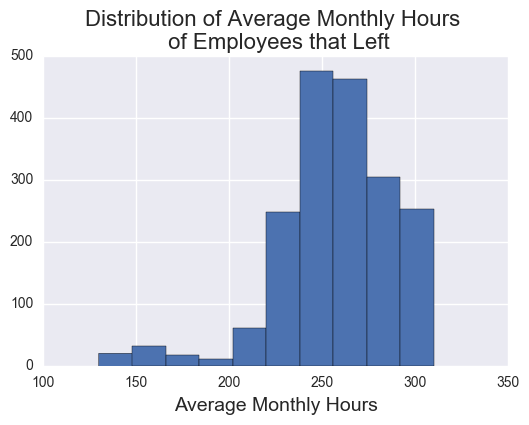
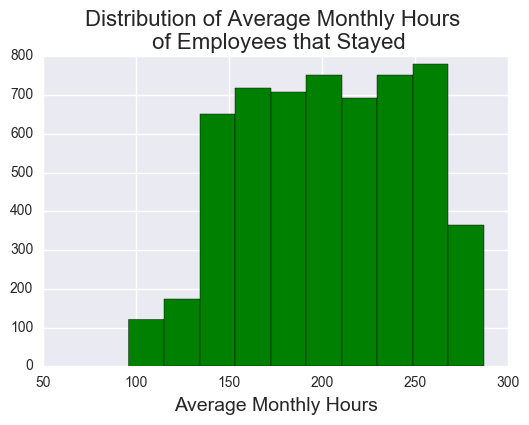
The histogram (above) average monthly hours for employees that left show that they generally worked more than 200 hours (45 hours a week). Histogram for average monthly hours for employees that stayed show that there was a uniform distribution for hours worked between 125 and 225 hours. So not only do employees that left get paid low/medium salary, they also on average worked 50 hours more than employees that stayed.
Analyzing salary and whether an employee has been promoted in the last 5 years, results show (below) that 99% of employees that left, were not promoted in the last 5 years, even with an evaluation of 0.71 and higher. Bulk of those employees were low and medium salaries. Looking at the satisfaction level , the satisfaction was lower for by at least 20% for employees that were not promoted in the last 5 years.
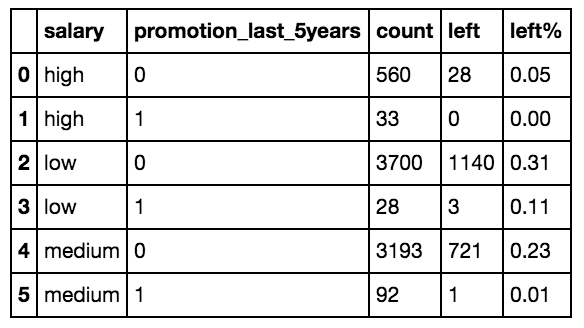
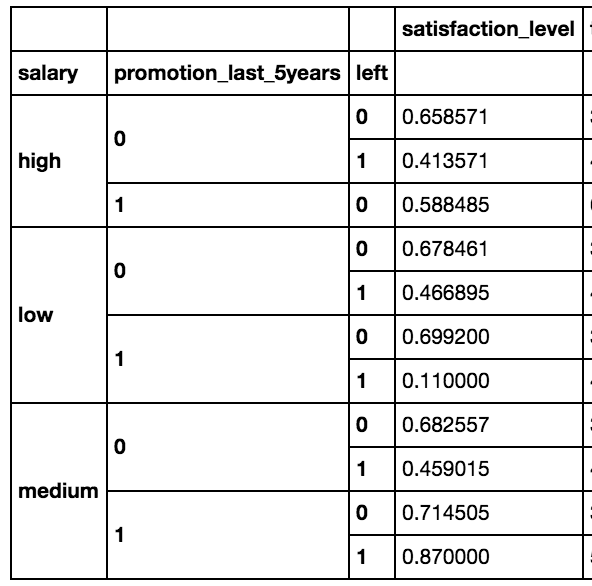
Thus, employees with at least 0.71 evaluation rating and not promoted in the last 5 years resulted in them leaving, probably to find greener pastures.
Predicting Employees that Left (Classification)
Hypothesis is that employees above 0.71 that have not been promoted will leave the company. Fortunately most of the left column matches up with this, so Using Random Forest/Extra Trees, there is no need for scaling of the data.
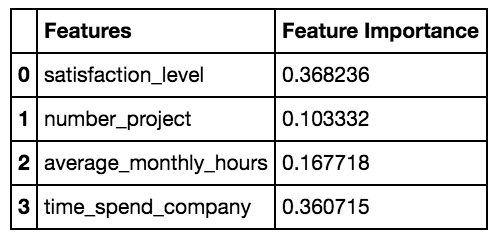
features used: After including all features in the Random Forest model, salary, promoted, work accident, sales were not significant features and thus ommitted. Features used in this analysis are:
- satisfaction level
- number of projects
- average monthly hours
- time spent with the company
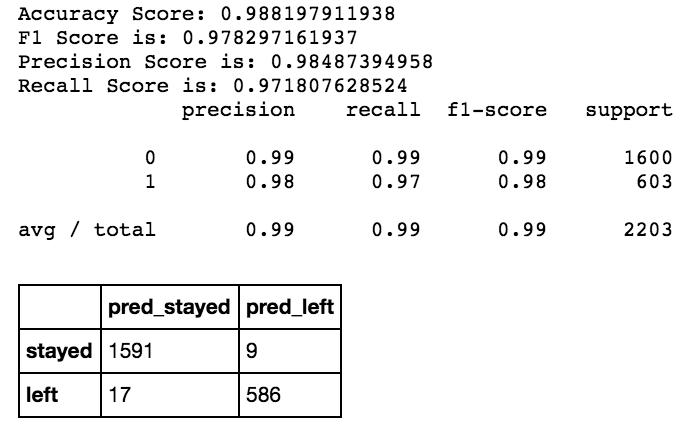
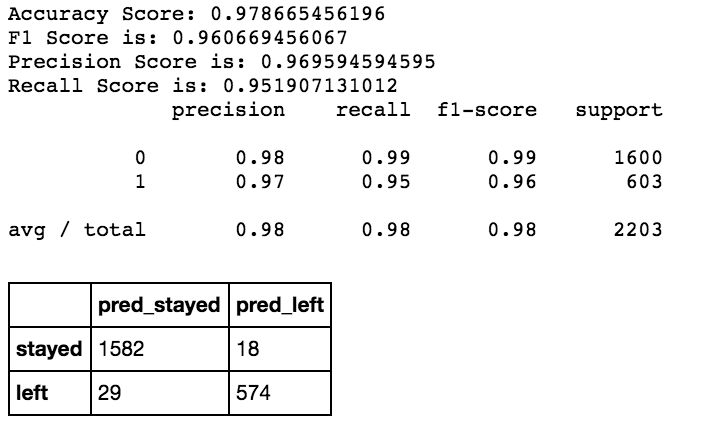
Random Forest
Random Forest has the highest accuracy, with 9 having Type I error and 17 having Type II error.
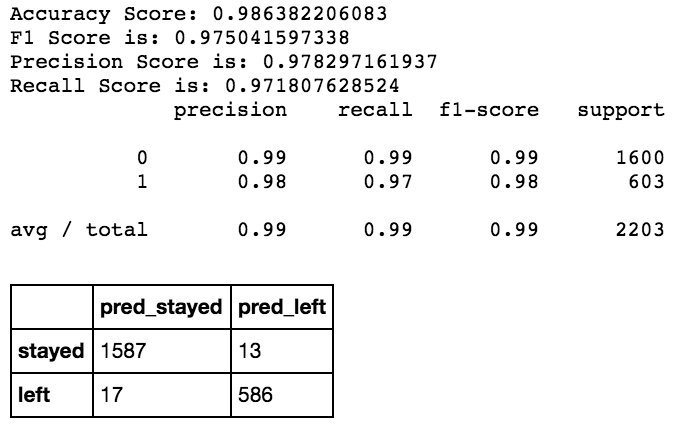
Extra Trees
Extra Trees has a higher Type I error and the same Type II error as Random Forest. Although overall accuracy is 0.001 less than Random Forest.
Gradient Boosting
Gradient Boosting has the lowest Type II error of all three, though the accuracy score is .01 lower than Random Forest model.
Classification Model Conclusion
If lowest Type II error is the goal (ensuring that model predicted that the employee stayed, but the employee left), then Gradient Boosting Model is the best one, even though accuracy is lower. Since the accuracy is 0.01 lower, that is pretty negligible.
Predicting Satisfaction Level (Regression)
Instead of predicting which employees left, let’s see if we can predict the satisfaction level of the employee. Ultimately that should be the goal, happy employees will perform better and stay. This will be tackled later.
Conclusion
In determining why employees leave, the obvious reason is that their last evaluation score was low, below 0.5, which was about 25% of the sample. The question is, why do good employees leave? From data analysis is that for employees that scored at least 0.71 on their evaluation, 99% of the employees that left did not receive a promotion in last 5 years.
From prediction, Random Forest, Extra Trees, and Gradient Boosting all had high accuracy. For the highest accuracy Random Forest did the best, and for lowest Type II error, Gradient Boosting was the best. That being said the difference between all three is minimal.