Short-Term Rental Platform vs Long-Term Tenant: Evaluating Expected Profits
Introduction/Summary
Short-term rental industry as of late as been a big focus for the sharing economy and local and state government. People who have been putting their dwelling (Hosts) on platforms such as AirBnB and HomeAway are able to make money by making use of empty room or perhaps their whole house or apartment on these platforms. Local and State governments are taking notice because these platforms are bypassing the local Hotel Occupancy Taxes that local Hotels have to pay. No doubt the Hotel Lobbyists are putting pressure like how Taxi Lobbyists put pressure on officials with Uber.
Property Management companies are also using these platforms because they can generate more profit than long-term leases, depending on what areas (i.e.Santa Monica, New York City). Sharing Economy tends to create a demand bubble, causing prices to increase. Due to this reason as well as bypassing Hotel Occupancy Taxes, many local and state officials are banning listings that are entire units. Austin, Santa Monica, San Francisco all have put severe restrictions into number of days that the unit can be listed, requiring permits, and/or banned entire unit rentals
The Jupyter notebook associated with this analysis can be located here.. The .py script files for scraping and data munging is located in the github repo which is located here..
Scenario
There are two scenarios entertained in this analysis:
-
Does putting extra room in a two bedroom unit on STR or long-term renter generate higher expected profit? There will be cost associated with operating a STR versus long-term renter, such as time spent on guest management.
-
Assuming that putting entire home/unit on STR platform has no legal issues, which units will generate higher expected profits?
Methodology & Data Sources
Using AirBnB data and Zillow data, I will use a machine learning algorithm to predict Airbnb prices by month by neighborhood and by bedrooms to get a sense of how pricing differs by neighborhood, bedrooms and month (seasonality). By calculating the average yearly price and occupancy for each neighborhood, I can evaluate rental listings on Zillow to see expected profits. Model I being for a private room, and Model II for being the entire home/apt for studios, one bedroom, two bedrooms, three bedrooms, and four bedrooms.
The pricing for Model I will be applied to the two bedroom homes that are in the Zillow dataset. Two bedrooms will be analyzed because if I were to occupy one of the rooms, the other room can be put on STR platform or available for a long-term tenant. The baseline will the latter, so the expected profit would be the expected revenue less the yearly cost for that apartment. Of course there will be opportunity costs associated, such as furniture cost for the room, utilities, guest management (answering questions, meeting the guest at check-in/checkout), and maybe there is a brokerage fee.
For Model II, the algorithm will be applies to the Zillow data based on neighborhood and bedrooms.
There are terminology that the Hotel industry and STR industry also uses, such as the following:
1) ADR: Average Daily Rate ($ per night)
2) Occupancy: It is the amount of days occupied in a given time frame (i.e Month, Year)
3) RevPAR: Revenue per Available Room, it is ADR*Occupancy, or monthly or yearly revenue / (amount of days in the time frame)
The data sources used in this analysis were:
1) Zillow
-
Links were manually entered by finding the URL for specific neighborhood in Zillow.
-
Scraped Zillow Listings for most of Manhattan and for most of Brooklyn.
2) AirBnB
-
The data for AirBnB was downloaded from http://insideairbnb.com/get-the-data.html.
-
It is uncertain how the data was pulled, as a lot of contributors were assocated with this website.
For more detailed information on Zillow and AirBnB methodology, please see the jupyter notebook.
Trends
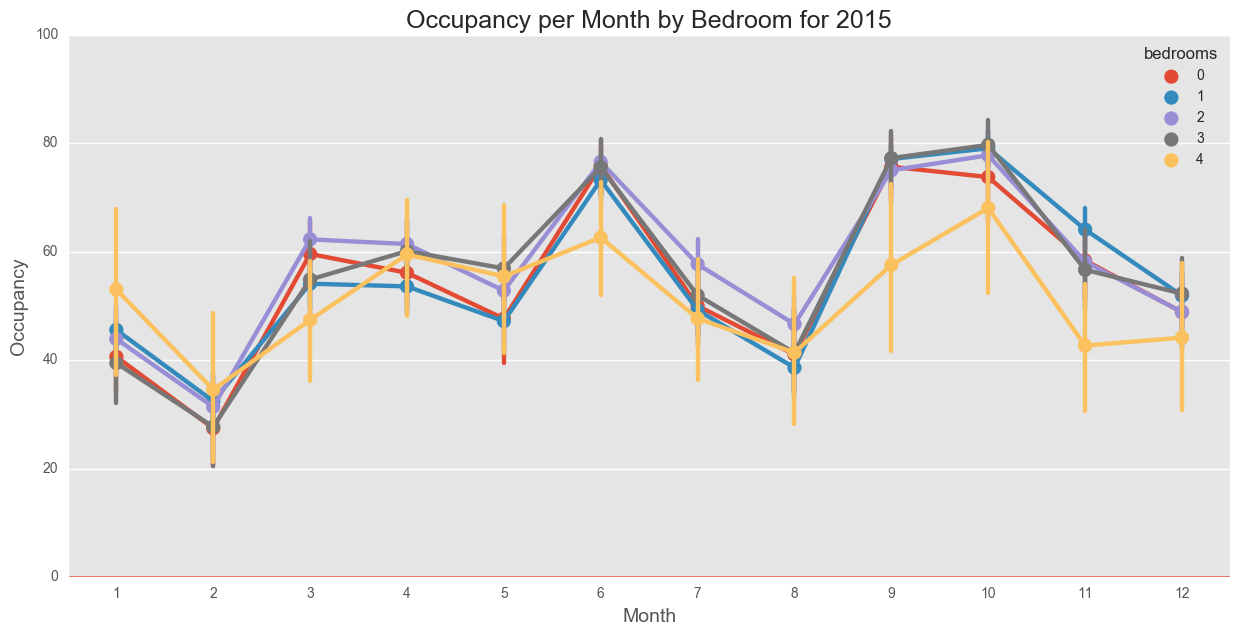
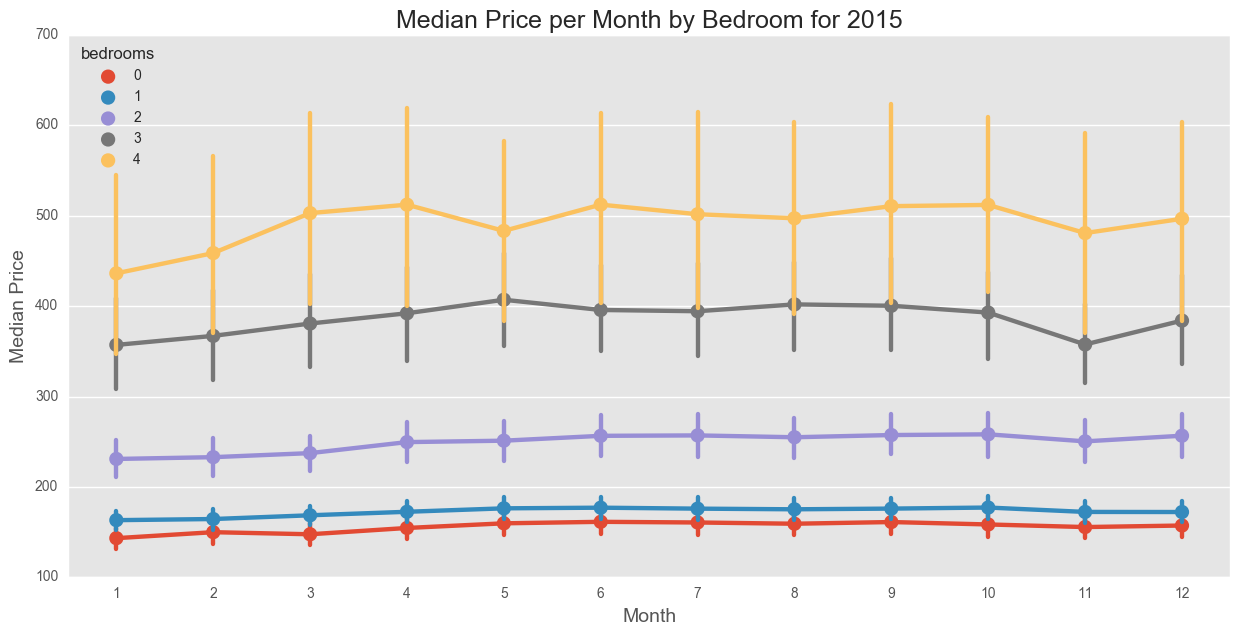
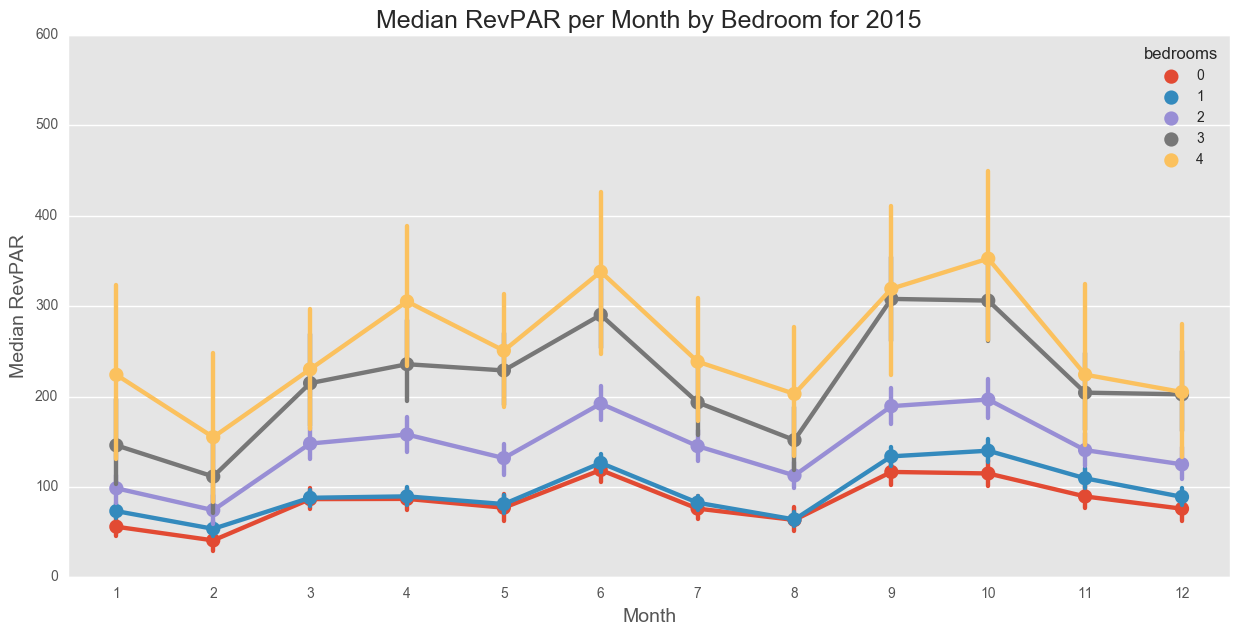
There is a definitely sign of seasonality for NYC. Generally, May, June, September, and October are the peak months. The following are the occupancy %, avg price, and RevPAR for 2015. Because the scrapes from insideairbnb.com were not that consistent, they missed May 2015, which shows occupancy and ADR lower than June. On Average, prices were flat for studios, one bedroom, and two bedrooms, while saw some price fluctuations for three and four bedrooms. Thus, on average, hosts do not implement dynamic price model. Hosts should price according to demand, such that in peak seasons, they increase prices, and in low season, they drop prices if their goal is the maximize profits. The graphs show min and max which are the horizontal lines at each point.
2015 Data
Model I
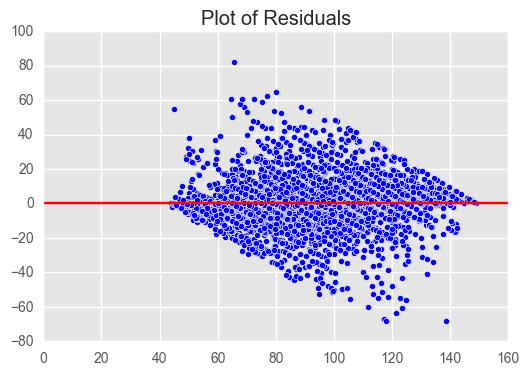
Predicting prices for Private Rooms yielded poor results. While the MSE for Extra Trees was lower than Linear Regression and Gradient Boosting, and thus higher correlation, there is an pattern of correlation in the errors when the residual was plotted. The variables were Number of Reviews, Rating, Month, Number of Competitors, Occupancy %, and Neighborhood
The MSE: 155
R-square: 0.74
The residuals show a pattern, which is an indication of a missing feature.
Model I Results
There are patterns in the residuals indicating that there is under-fitting. There seems to be one or more features that are missing from the model. It is harder to explain the price differences among private rooms as number of bedrooms isn’t a feature, since there is only one bedroom. By evaluating the feature importances, number of reviews, neighborhood, and rating are the top 3 features. If a person is looking for a room, it is very likely that he/she are looking for a credible listing, one with highest reviews, rating in the neighborhood they are wanting. Since these people are most likely traveling alone, they looking to minimize the cost of a room, thus are shopping for a Private Room and not an Entire home/Apt. Occupancy% and Month are not factors, meaning they are not pressured by seasonal factors. Two features that are not available are photo quality and listing quality. These two are important features when deciding on a listing.
Another model was done on 2016 data, given that the listings csv had more columns to choose from such as whether a host is a superhost, whether the unit is instant bookable, host response rate, and host response time. The model did not perform any better, so the conclusion is that there are other features that might explain the price differences, such as listing quality, and photo quality.
When applying prices to Zillow, yearly averages will be used (per neighborhood) to gauge the profitability per Zillow listing.
Model II
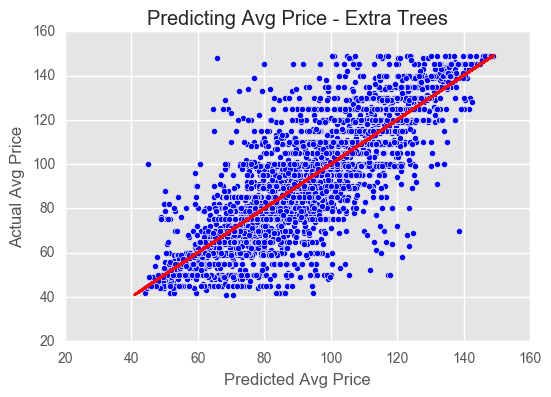
Model II focused on entire units using the same features as Model I, and also included number of bedrooms. Like Model I, Extra Trees performed better in terms of MSE/R-squared than Linear Regression and Gradient Boosting.
MSE: 1027
R-square: 0.89
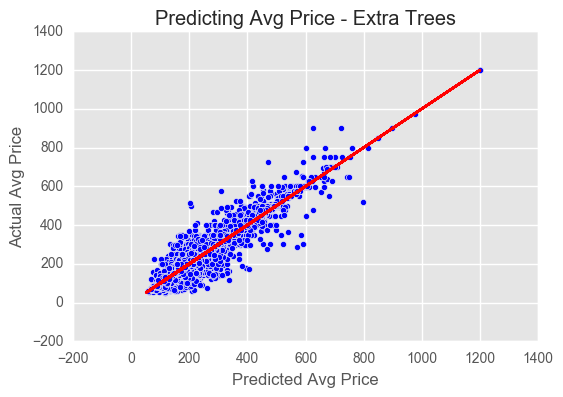
The residuals show a slight hint of a correlation, which is an indication of a missing feature, especially in the lower price ranges.
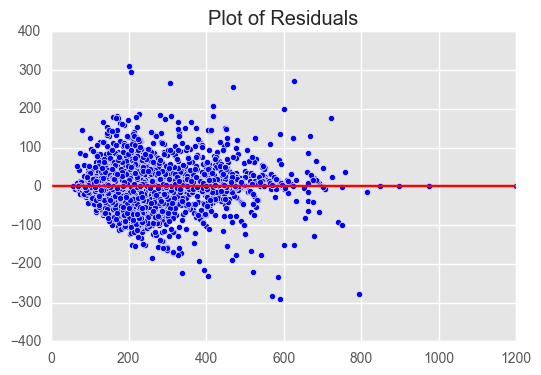
Model II Results
Linear Regression had the highest MSE/lowest correlation, following by Gradient boosting, and then Extra Trees. Extra Trees is the preferred model given it yielded the best results. Extra Trees uses resampling of observations, and also features, so the bias is lower but the variance is higher than other Tree algorithms. There does seem to be a trend in the residual plots meaning there is a feature that is not present in the model. This could be the photo and listing quality as previously stated, they are important features on listing decision by guests.
Findings/Results
Extra Trees was the model of choice given that is takes random sample of the observation and features. This results in lower bias, but it can lead to higher variance than other tree-based models. There is also indication of patterns in the residuals indicating missing features, such as photo quality and listing quality, which can make or break a listing. Unfortunately, do not have those features available.
When applying yearly avg price by neighborhood to Zillow rental listings, the preferred area for private room and entire home/apt is in Midtown. This is because it is a high tourist area, but low demand for locals to live there. Thus, price per sqft is cheaper than lower Manhattan. The spread between the price that a host can charge on a STR platform versus the rental price per day (rental price divided by 30) is higher than other neighborhoods in Manhattan. Clinton Hill faired pretty well for Brooklyn, as it is less costly than DUMBO, but pretty accessible to lower Manhattan.
Link for Tableau showing visualization for Private Rooms
Future Considerations
Getting calendar data that is scraped regularly, especially if it includes peak months, would yield better occupancy levels. Also this would result in more efficient price computation. Tidying up the Zillow scrape to where it scrapes coordinates and doorman (would be used as a proxy for more luxurious apartments) would be the next phase after this analysis.
It would be useful to download future Airbnb calendar scrapes to give a better average price per month, which should give more accurate results for expected profits.