KMeans++ Cluster Analysis using PCA on Airport Delays
KMeans++ Cluster Analysis using PCA on Airport Delays
This analysis investigates operations of major airports around the country to understand the characteristics of departure and operational delays:
- A certain degree of delay is expected in airport operations, however the FAA is noticing significant delays with certain airports
- When a flight takes off, it’s departure delay is recorded in minutes, as well as operational data relating to this delay
- At the end of the year, this data is averaged out for each airport. Your datasets have these averaged for a 10 year range between 2004 and 2014
- Over this 10 year range, some delay times have not improved or have worsened.
The Jupyter Notebook associated with this blog, can be found here.
Hypothesis:
Taxi Out time (time it takes to leave the airport from gate) is associate with congestion time. The number of flights in and out of the airport would cause the taxi out time to increase as the number of runways is limited. This will play a huge factor in departure delays. The variation between clusters should highlight the importance of this feature.
The Dataset
1) Airport List of attributes per each airport
2) Cancelations Cancelation dataset list cancelations and diversion per each year from 2004 to 2014
3) Operations Operations dataset lists delays, departures, arrivals and other operational metrics
Assumptions and Risks
1) Use Diversions and Cancellations as a proxy for weather.
2) Taxi out time is a factor of number of flights and runways, such that a higher ratio of number of flights/runways will increase taxi out time.
3) FAA regions will be used to separate airports.
4) Not able to determine if weather caused departures.
5) Not able to weed out the % are due to mechanical failures, as gate departure delays could be due to late arrivals and weather.
Exploratory Data Analysis & Visualizations
Two categorical variables created, based on the hub and spoke model of airports. Major hubs, secondary hubs, and spokes for ‘ap_class’. Taking one step further and pulling out ATL and ORD into its own group is the variable ‘ap_size’. FAA region class was created giving a number to each region. Airports were averaged over the years in the data, as there will be an airport in multiple clusters when doing the analysis. Analyzing the correlations between the features, there was multi-collinearity among many of the features. PCA will need to be conducted to reduce dimensionality.
To re-iterate, ap_size is 0 for spoke airports, 1 for secondary hubs, 2 for major hubs, and 3 is ATL and ORD, which are the two busiest airports.
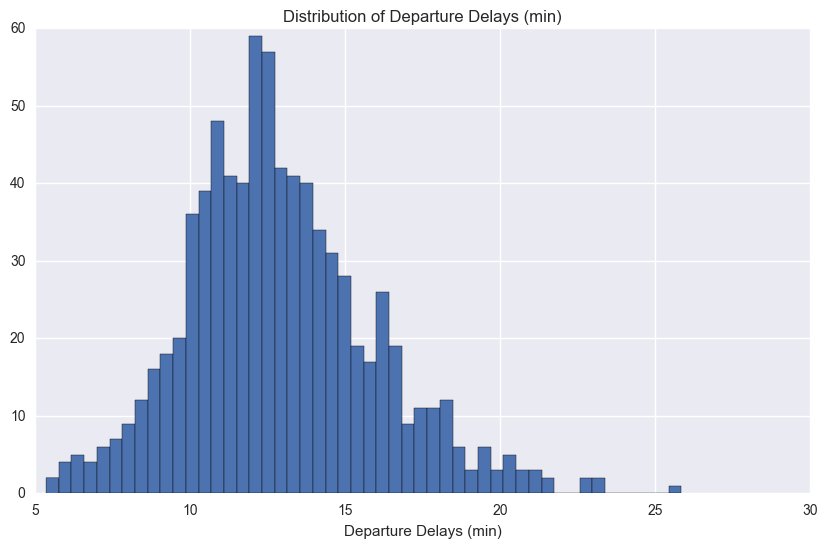
Histogram of Departure Delays shows approximately a normal distribution
Next four graphs shows a positive linear relationship among the variables in the graphs.
Percent on-time gate arrivals vs percent on-time gate departures
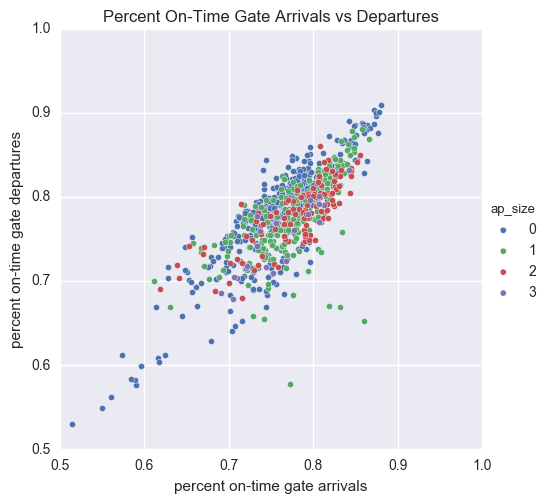
As percent on-time gate arrivals increases, so does the on-time gate departures, which makes sense, as the turnaround time for a flight is the constant. The amount of time it takes to get passengers off, re-fuel, getting the plane ready for the next flight, and getting passengers onboard, should take the same amount of time. Therefore the on-time gate departures depends on if the flight arrives on-time.
Departures vs Average Airport Departure Delays
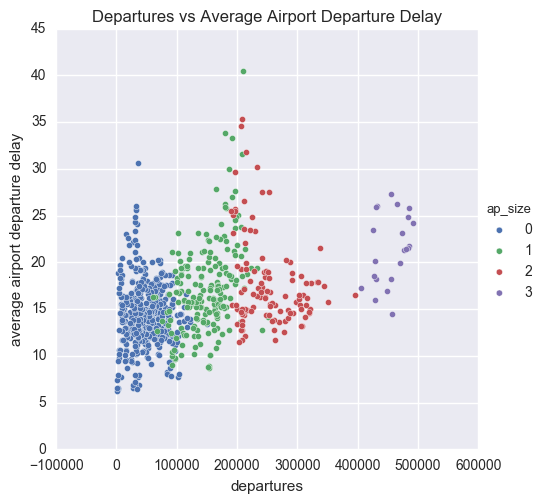
While departures increase, there is a slight increase in departure delay. This shows while there is a slight increase in delay with more flights, airlines/airports handle the logistics efficiently, otherwise we would see a more positive correlation.
Taxi Out Time vs Taxi Out Delay
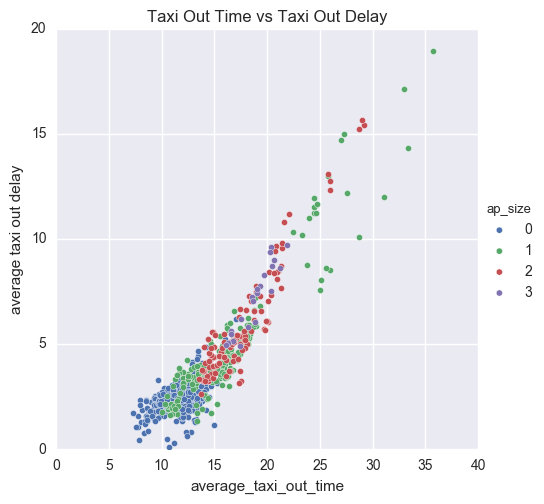
Longer the taxi time for an airport, the higher the delay. This could be that there is a take-off queue which is causing the time and delays to increase.
Average Gate Arrival vs Departure Arrival Delay
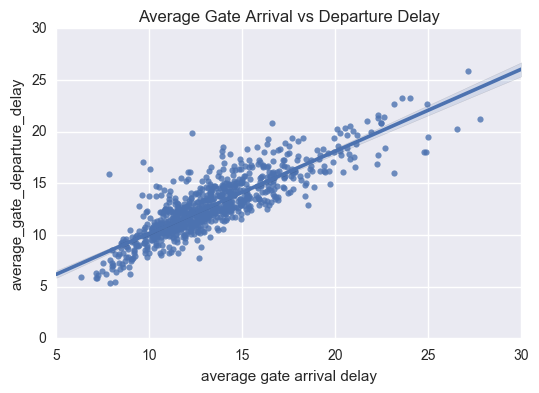
This graph re-iterates the percent on-time arrival vs percent on-time departure. If the flight arrives late, the flight departs late, but not at a 1 to 1 relationship, meaning that the airline tries to make up time in the turnaround process.
Features to Consider
-
FAA Region Dummies: There might be similarities in terms of air traffic flow, such as new york area airports, or north east in general
-
Percent on-time gate departures, airport departures, gate arrivals: These are all percentages, this details the metrics for airport in terms of percentages of flights
-
Average gate departure delay, taxi out delay, airport delay, taxi-in delay, average block delay, gate arrival delay. These are all the associated delays
-
Taxi out time: Taxi out time should be a ratio of number of flights and number of runways. High flight/runway ratio, would mean longer lines to take off.
Not Considering
- Departures, Approvals: This is the highest varied features, which resulted in the class labels following the number of departures.
- Diversions/Cancellations: Any diversions and cancellations should not affect Delay, as it has not left/arrived at the airport
PCA - Principal Component Analysis
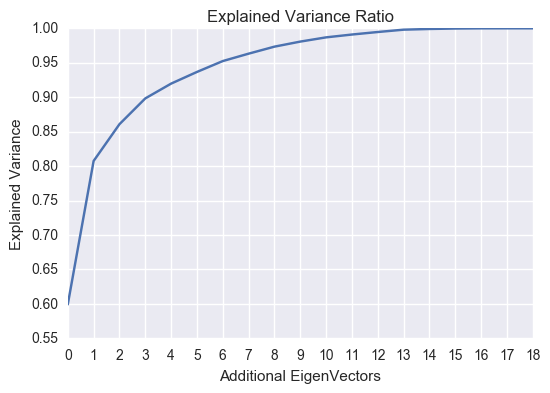
Using the features listed in the previous sections, PCA was performed using Robust Scalar to scale the data. From the Explained Variance Ratio, the number of components/features will be set to 2.
Explained Variance Ratio:
Using Distortion (Inertia):
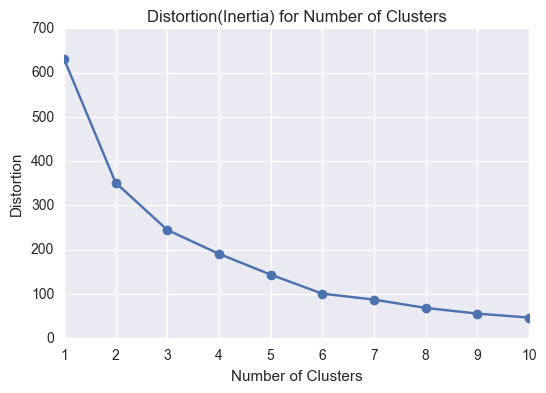
This graph shows the inertia metrics for each cluster. The number of clusters increase, the density of the clusters increase (distortion decreases).
Using numer of components = 2, the KMeans++ cluster model gives the following clusters:
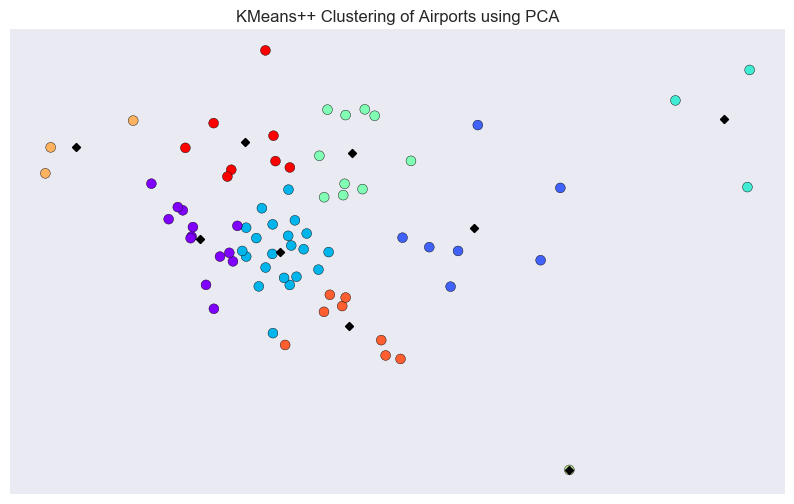
The silhouette score for 8 clusters was 0.39. While that may not be high, it provided the best clusters in terms of groupings. The best silhouette score was 0.54, which was for 2 clusters. The cluster of 2 did not distinguish each cluster enough to make an analysis, while 8 did.
Performing a groupby on the cluster labels, using average of all the airports, gives us the following:
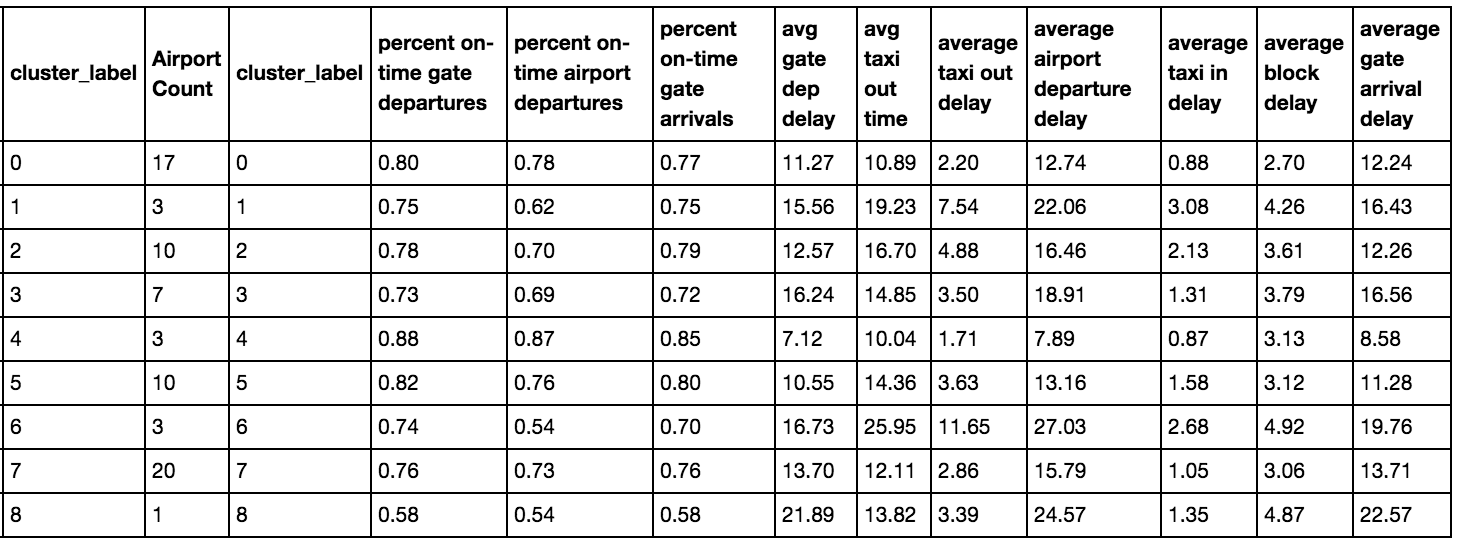
Analyzing these results, shows how each cluster varies in each column. For example, clusters 2 and 4, show approximately the same percent columns, but the only difference taxi out time. Another example would be clusters 1 and 7, show that percent on-time gate departures and arrivals are equivalent, but percent on-time airport departures and avg taxi out time are different. Cluster 8 is an oddball, it had only 1 airport, which was HPN (White Plains airport), which could not be grouped with another cluster. This would be considered as noise. Clusters 3 and 6 shows the close gate departure delays, but vastly different taxi out time and taxi out delay.
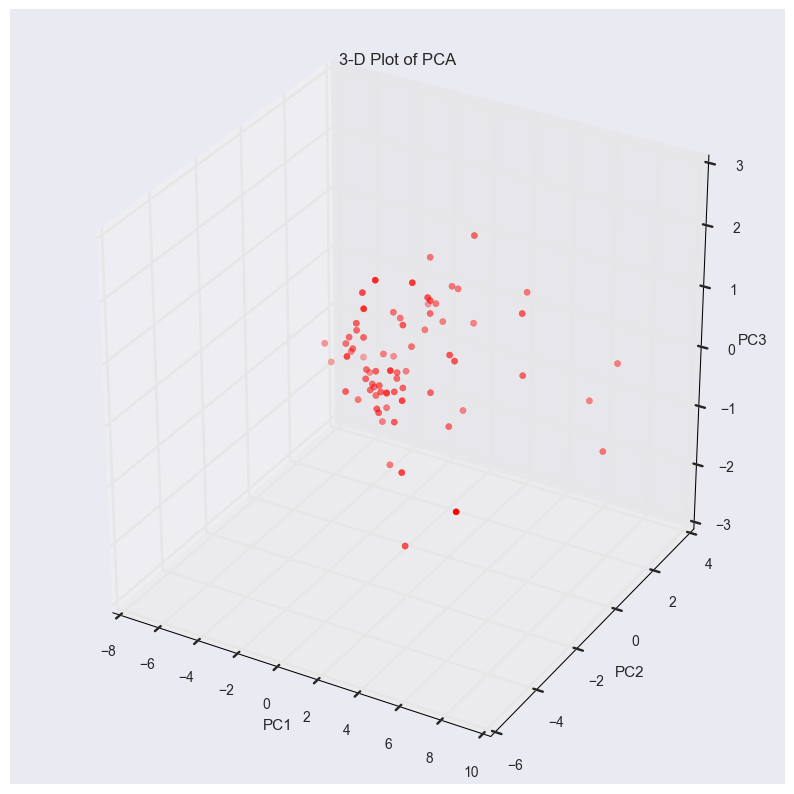
Using 3 Principal Components gives us the following 3D graph:
Conclusion
The operational features are most correlated with delays are taxi out time (how long it takes from gate departure to take off), size and proximity of airports (more frequency of flights generally the more congested), and of course the the arrival of the plane. If the plane arrives late, the turnoaround time for offboarding, re-fueling, and on-boarding will be the same regardless of when it comes. Thus, if the plane arrives late, it will lead to departing late. Weather related data isn’t known, but could use a proxy for departure cancellations and arrival diversions.
Airport’s Next Steps should be ensuring the following:
1) Ensuring that proper equipment for weather is accessible, such as de-icing, snow plow etc…
2) If frequency of flights/runways is high, thus causing long taxi delays, cost-benefit analysis on building another runway.
3) Increase gate fees associated to airlines, thus only the more profitable companies can fly in/out. This should reduce number of flights. This would be similar to a usage tax.
4) Ask airlines to increase the flight time to incorporate the average delays.