A Classification Analysis of Titanic Survivors
A Classification Analysis of Titanic Survivors
This project examines the probability of survival in the Titanic disaster using Classification models. Several models will be evaluated, such as Logistic, Gridsearch using Logistic, KNN, and Decision Trees. The dataset is accessed via a remote database, in which Exploratory Data Analysis is performed to select the features used in the models. The Jupyter Notebook and data set can be found here.
Exploratory Data Analysis
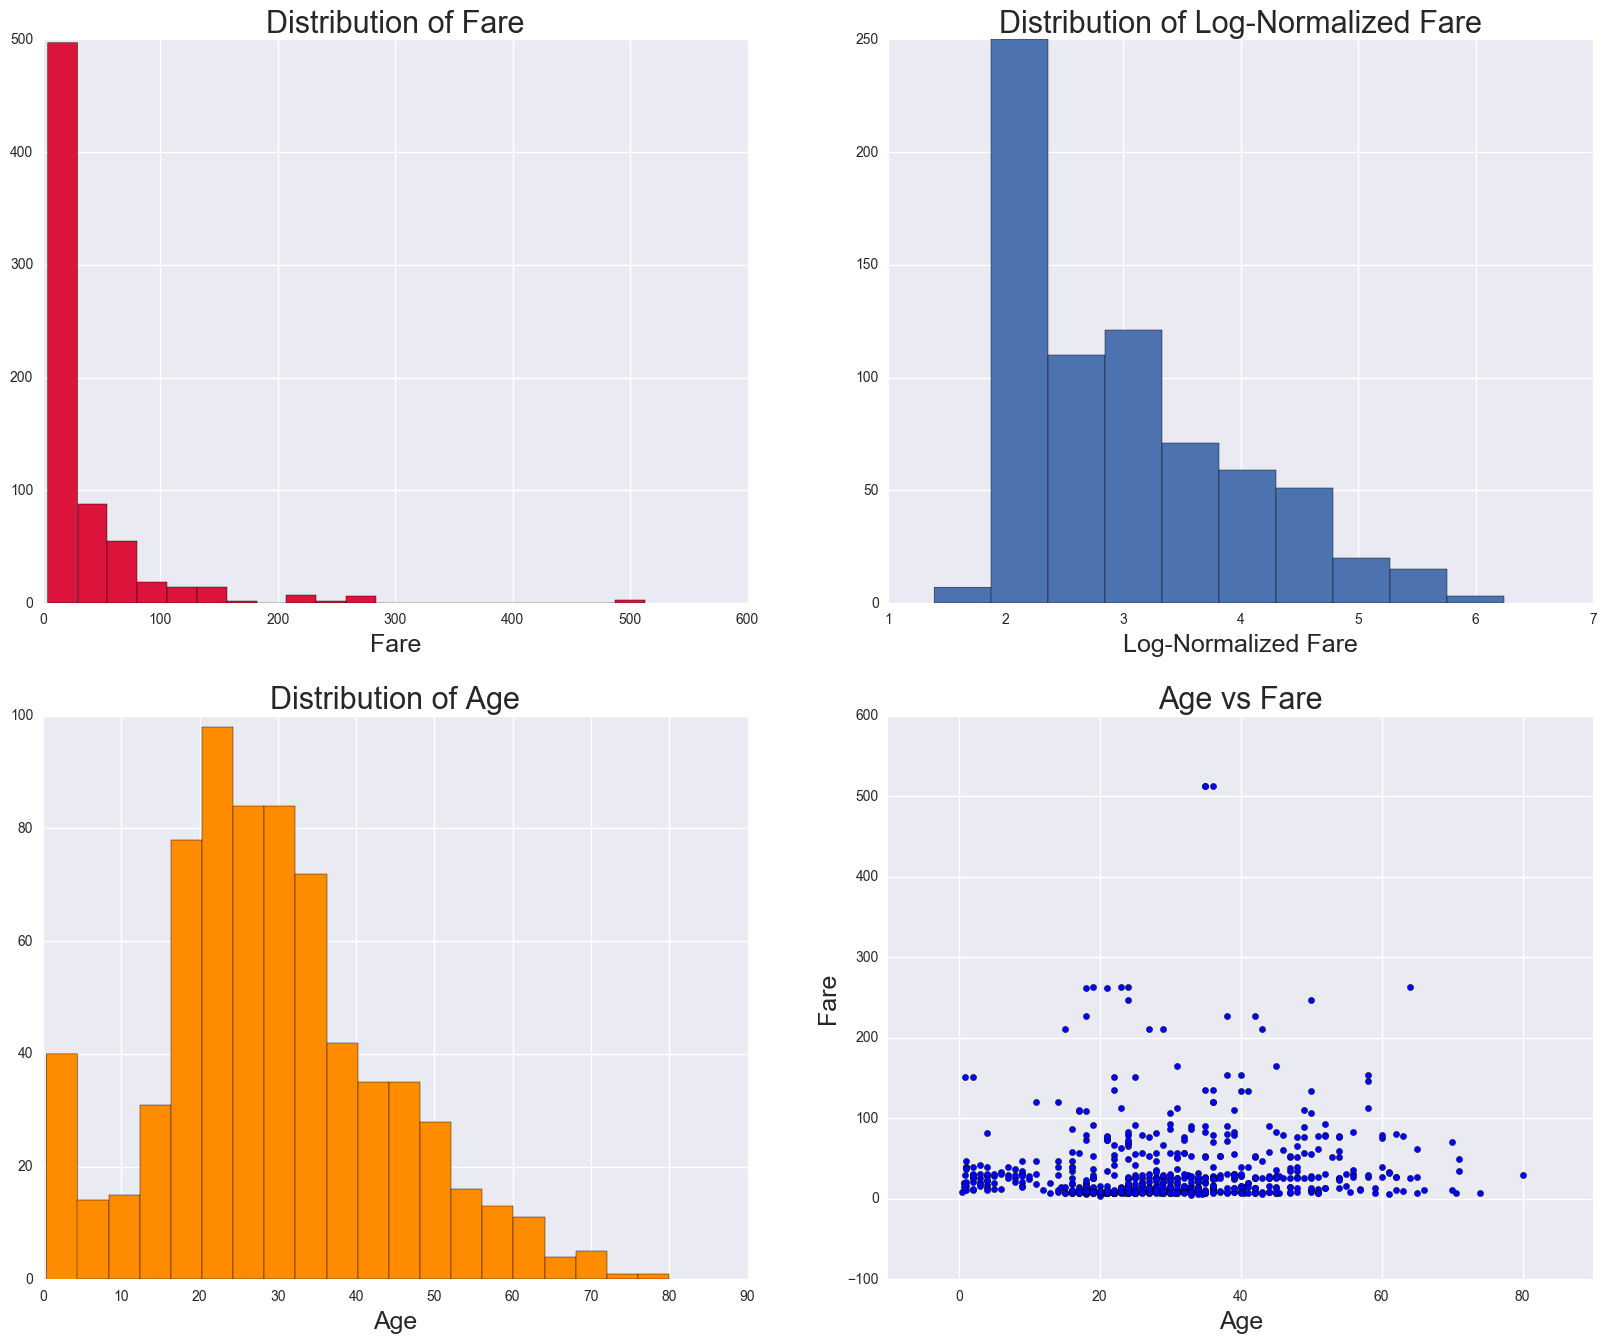
The following features are categorical variables: Pclass and Sex. Age is a continuous variable, are binned into Child, Teenage, Young Adult, Adult, and Senior groups, thus categorical variables. Fare (see histogram below) will be normalized as it is skewed. Sibsp and Parch will be used as continuous variables.
Model Validation
Features used in Model Validation: Pclass, Sex, Age_bins, Sibsp, Parch, and Fare (normalized). The class label is whether the person survived or not (survived).
The model score, F1 score (which is a weighted average of the precision and recall), and AUC will be used to compare each model. Considering this is an evaluation of a disaster, where the two classes are either survived or dead, minimizing false positives (predicting survived, but actually dead) should be of highest important, especially when the disaster already occurs.
1. Logistic Regression
A logistic regression was used in the first model, with L2 as the penalty. The following are the confusion matrix, model score, and F1 score:
Confusion Matrix:
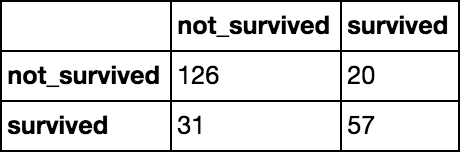
Model - Score: 0.78205
F1 Score : 0.6909
2. Gridsearch with Logistic Regression
A Gridsearch CV was used in the second model, which gave a penalty of L2. The following are the confusion matrix, model score, and F1 score:
Confusion Matrix:
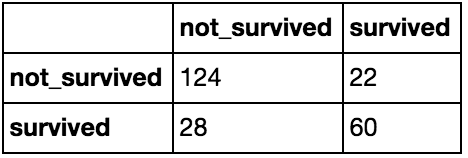
Model - Score: 0.78632
F1 Score : 0.70588
The model score and F1 score show a slight increase than the logistic model
3. Gridsearch with KNN
Confusion Matrix:
A Gridsearch CV was used in the second model with KNN as the estimator. The following are the confusion matrix, model score, and F1 score:
Confusion Matrix:
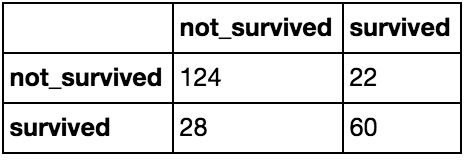
Model - Score: 0.80341
F1 Score : 0.70129
The model score faired better here than in the Gridsearch with logistic as the estimator, while the F1 score was slightly worse. The confusion matrix yielded same results as the GridSearchCV with Logistic Regression.
4. Decision Trees
Decision Tree was used in the last model. The following are the confusion matrix, model score, and F1 score:
Confusion Matrix:
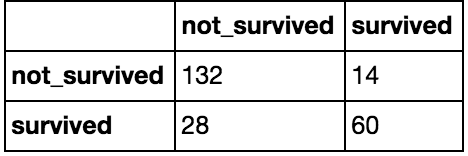
Model - Score: 0.82051
F1 Score : 0.74074
The model score and F1 score were the highest with Decision Tree.
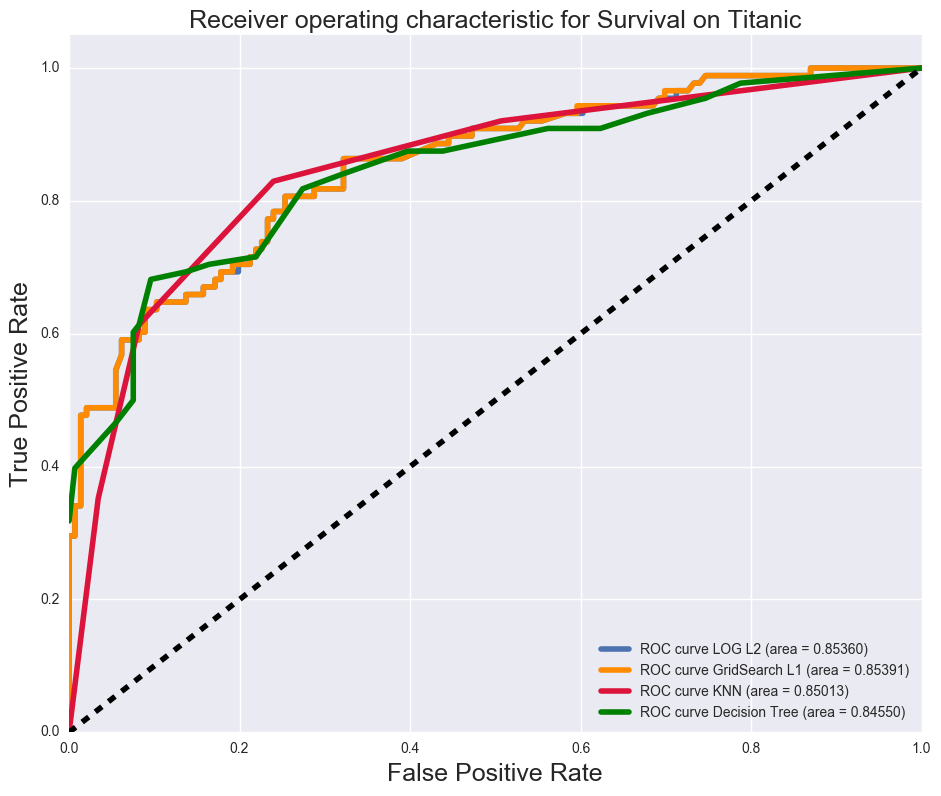
ROC Curve for each model:
Below are the ROC curves for the models. All models have approximately the same ROC (largest difference is 0.008)
Conclusion
After evaluating the models, the Decision Tree resulted in the lowest False Positives, and its AUC score was slightly below the others (approximately 0.008). The reason why finding a model minimizing False Positives, is that in a disaster, the authorities in charge of recovery would not want to say a high number of people predicting that they are alive, yet actually being dead, as it would take a huge toll on their friends and family. Considering the AUC scores for all the models were in close approximation, the Decision Tree model yielded better model score and F1 score.